FinanceFirst Research

The Real Cost of Health Insurance: Premiums, Care and the Early-Bill Test

A 2026 evidence report and reproducible comparison of annual cost and money needed early.

By 15 min readEditorial standards
Download data ↓

Compare dated employer coverage evidence with two hypothetical plans. See why a lower annual cost after employer HSA funding can still mean a larger early medical bill.

Key figures 3 findings
Average annual worker contribution for family premiums
$7,471

KFF 2026 employer survey, covered workers; not total household healthcare spending. Source and scope below.

Plan A’s annual cost in the $10,000 scenario
$350 less

Hypothetical one-person model; after $750 received employer HSA funding. Before funding, B is $400 lower.

Plan A’s liability for an early $3,000 service
$1,600 more

Hypothetical; before employer funding. Billing dates are not modeled.

What health insurance costs: three different tests

A health plan can look inexpensive on payday and still require cash you do not have when a medical bill arrives. In FinanceFirst's comparison of two invented plans, Plan A costs $350 less over a full year after employer HSA funding at $10,000 of covered allowed charges, yet assigns $1,600 more liability for an early $3,000 service. These results are examples, not estimates of how often a plan type wins.

This report combines dated national evidence with a reproducible model. It separates the price of keeping coverage, the cost of using it, and the money available when a bill becomes due. The original contribution is the comparison and cash-timing test; FinanceFirst did not conduct a survey or collect insurer quotes.

Research cutoff: November 7, 2026. National observations describe 2026 employer benefits. The model covers one hypothetical person for 12 months. All amounts are nominal U.S. dollars. This is an employer-plan comparison, not a forecast of 2027 benefits or Marketplace premiums.

QuestionMeasureWhy it matters
What leaves each paycheck?Required employee contribution × actual deduction countA monthly equivalent is not a payroll schedule.
What does the year cost?Employee premiums + modeled cost sharing, with employer funding shown separatelyA deductible alone cannot identify the cheaper plan.
Could I manage an early bill?Service liability less funds already availableFuture savings and future deposits may arrive too late.

The family premium headline is not the worker’s bill

KFF's 2026 survey reports an average $28,303 total annual family premium and $7,471 worker contribution. These are means for covered workers, not medians or quotes for all households. FinanceFirst divides the worker figure by 12 to get $622.58 a month; it is a monthly equivalent, not an observed deduction. Source: KFF, Summary of Findings, premiums and worker contributions.

2026 family coverageAnnual dollarsMonthly equivalent
Total premium$28,303$2,358.58
Worker contribution$7,471$622.58
Employer remainder, calculated$20,832$1,736.00

The employer remainder is 28,303 minus 7,471, using rounded published inputs. It is not additional household spending or a promise of cash wages if coverage is declined. Neither premium figure includes the household's cost of using care.

For family coverage, covered workers at firms with 10–199 workers contribute an average $9,687, versus $6,840 at firms with 200 or more. The calculated gap is $2,847 annually, or $237.25 monthly. These descriptive groups do not establish what an individual job offer costs. Source: KFF, Figure C and worker-contribution discussion.

Ask for the contribution schedule for your actual coverage tier when comparing jobs or a spouse's benefits. Do not combine a family premium with an individual deductible and present it as one coherent plan.

Avoid adding the deductible twice

A deductible is a rule for sharing applicable covered expenses, not a bill that every enrollee automatically pays in full. Coinsurance is the member's share of the relevant covered allowed amount after the deductible. An allowed amount is the price recognized by the plan for that service, which can differ from the provider's billed price. HealthCare.gov explains premiums, deductibles and cost sharing.

The applicable out-of-pocket maximum includes eligible deductible and other cost sharing for covered in-network services. Premiums and excluded costs are outside that boundary. See the official definition and exclusions.

For the simplified plans below, a high covered-use budget is annual worker premiums + applicable out-of-pocket maximum. Adding the full deductible again would double-count spending. Then list any excluded exposure separately. This boundary does not cap every healthcare expense.

Different service rules, family structures, network limits and authorization requirements can change the calculation. Check the actual plan documents before transferring this simplified rule to a real decision.

Two invented plans, with every assumption visible

Both examples cover one person for a full year. They cover the same modeled services at identical allowed prices. All charges use a single deductible and then 20% coinsurance until the applicable maximum. No copays, separate drug rules, taxes, account fees, investment returns or noncovered care are included. We assume Plan A is HSA-qualified, the worker is eligible, and the entire employer contribution is received and owned.

Hypothetical termPlan A: lower premiumPlan B: lower deductible
Employee premium each month$180$280
Annual employee premium$2,160$3,360
Deductible$3,000$1,000
Member coinsurance after deductible20%20%
Covered in-network maximum$6,500$4,500
Employer HSA funding$750$0

These are invented designs, not insurer offers or market averages. Download the editable input CSV or JSON inputs. Neither design is automatically appropriate for a particular household.

Employer funding can reverse the annual comparison

At $10,000 of covered allowed charges, Plan A assigns $3,000 plus 20% of the remaining $7,000, or $4,400, to the worker. Plan B assigns $1,000 plus 20% of the remaining $9,000, or $2,800. Plan A's $1,600 extra cost sharing exceeds its $1,200 premium saving.

Before employer funding, Plan B costs $400 less: $6,160 versus $6,560. Subtract Plan A's fully received $750 employer HSA contribution once, and the annual comparison reverses: $5,810 for A versus $6,160 for B. A is $350 lower on this economic measure. This is not necessarily $350 less cash leaving a checking account.

Allowed chargesA: premium + sharingB: premium + sharingA: less employer fundingB: less employer funding
$0$2,160$3,360$1,410$3,360
$500$2,660$3,860$1,910$3,860
$3,000$5,160$4,760$4,410$4,760
$10,000$6,560$6,160$5,810$6,160
$20,250$8,610$7,860$7,860$7,860
$50,000$8,660$7,860$7,910$7,860

Unused employer HSA money is counted as an asset in the funding-adjusted measure. At zero care, A still has $2,160 in premiums; the $1,410 comparison value does not mean the premium fell. The assumed $750 remains in the account.

At $50,000 in modeled covered charges, both plans reach their maxima. After employer funding, A costs $7,910 and B $7,860. B is then $50 lower. A label such as “high healthcare use” does not identify a winner without the actual terms.

Tax tailwind: the payroll treatment can lower after-tax cost

At $10,000 of covered charges, Plan A assigns $4,400 to the member. The $750 employer HSA deposit leaves $3,650 for the worker to contribute. Assume both plans’ employee premiums are taken pre-tax through a cafeteria plan, and an HSA-eligible Plan A worker contributes $3,650 through a Section 125 salary reduction. At a 22% federal marginal rate plus 7.65% employee FICA, each eligible pre-tax payroll dollar avoids an illustrative 29.65% in taxes. That is $296.50 per $1,000 contributed.

12-month illustration at $10,000 covered chargesPlan APlan B
Existing funding-adjusted model cost$5,810$6,160
Pre-tax employee premiums$2,160$3,360
Pre-tax personal HSA contribution after employer deposit$3,650Not HSA-eligible in this example
Illustrative tax saving on assumed pre-tax payroll$1,722.67$996.24
After-tax cost under these added assumptions$4,087.34$5,163.76

On these added assumptions, A’s after-tax advantage is about $1,076, versus $350 in the original funding-adjusted comparison. The $750 employer HSA is still counted once; its value is separate from the tax savings on the worker’s salary reductions. Plan A’s $750 employer amount plus $3,650 worker contribution equals the 2026 $4,400 self-only HSA limit. Plan A’s $3,000 deductible clears the 2026 self-only HDHP minimum; Plan B’s $1,000 deductible does not, so B has no HSA payroll exclusion in this example. Eligibility and contribution limits depend on actual coverage and circumstances. IRS Publication 15 (2026) explains the Section 125 payroll exclusion; IRS Publication 969 covers eligibility and 2026 limits.

This is a tax illustration, not a revised output for the charts or downloadable base scenarios. It assumes federal 22% marginal tax, all relevant wages subject to the full 7.65% employee FICA, both premiums are pre-tax payroll deductions, full-year Plan A HSA eligibility, and timely contributions spent on eligible care. It excludes state tax and individual tax details. The saving arrives through payroll over time; it does not put the full HSA balance in the account on January 1 or erase an early bill.

The lower-cost plan changes with covered use

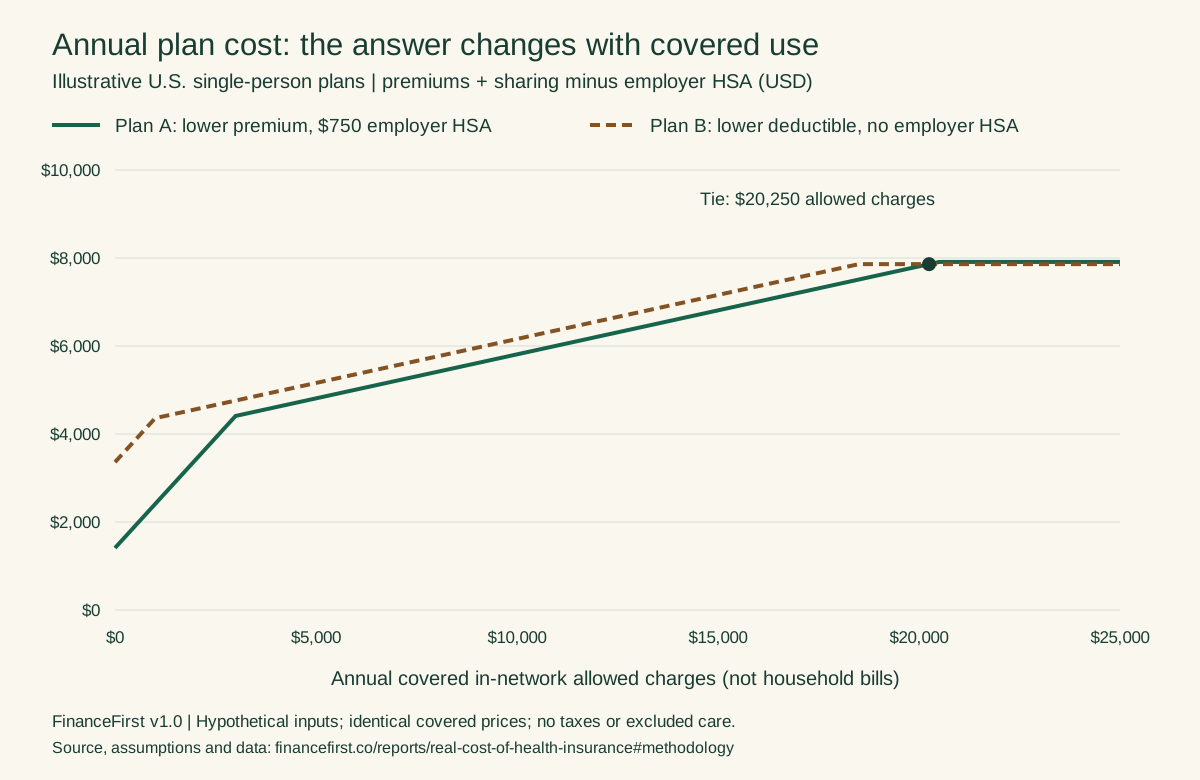
Hypothetical U.S. single-person plans, full year. Premiums plus modeled sharing less received employer HSA funding; not cash outflow or a forecast. Categories are allowed charges, not household bills.

A: $750 employer HSAB: no employer HSAAnnual funding-adjusted cost, USD
  1. $0 allowed
    A: $750 employer HSA: 1,410 USD
    B: no employer HSA: 3,360 USD
  2. $3,000 allowed
    A: $750 employer HSA: 4,410 USD
    B: no employer HSA: 4,760 USD
  3. $10,000 allowed
    A: $750 employer HSA: 5,810 USD
    B: no employer HSA: 6,160 USD
  4. $20,250 allowed
    A: $750 employer HSA: 7,860 USD
    B: no employer HSA: 7,860 USD
  5. $50,000 allowed
    A: $750 employer HSA: 7,910 USD
    B: no employer HSA: 7,860 USD
View chart data
The lower-cost plan changes with covered use
Period or categoryA: $750 employer HSAB: no employer HSA
$0 allowed1,410 USD3,360 USD
$3,000 allowed4,410 USD4,760 USD
$10,000 allowed5,810 USD6,160 USD
$20,250 allowed7,860 USD7,860 USD
$50,000 allowed7,910 USD7,860 USD
Source: FinanceFirst v1.0 scenario model; inputs and limitations

The $20,250 break-even depends on the assumptions

In this model, B reaches its $4,500 cost-sharing maximum at $18,500 in allowed charges. A reaches $6,500 at $20,500. Between those points, B's adjusted annual cost stays at $7,860 while A's rises with additional care.

A's adjusted cost in that interval is $3,810 + 20% × allowed charges. Setting that equal to $7,860 gives $20,250. At the tie, A has $6,450 cost sharing; B has $4,500.

The result is sensitive to employer funding. Keep every other term fixed and reduce A's employer contribution from $750 to $0: A no longer wins at $10,000 of charges. With $0 funding, the lower-use tie occurs at $2,500 of charges, and B is lower above it. Increase A's received funding to $1,000 and its high-use adjusted ceiling becomes $7,660, below B's $7,860; no high-use reversal remains.

This sensitivity check is why $20,250 is an explanatory result, not a universal rule for choosing an HSA-qualified plan. Different negotiated prices or uncovered services could alter the real comparison even if the benefit percentages looked identical.

An annual saving cannot pay a bill before it exists

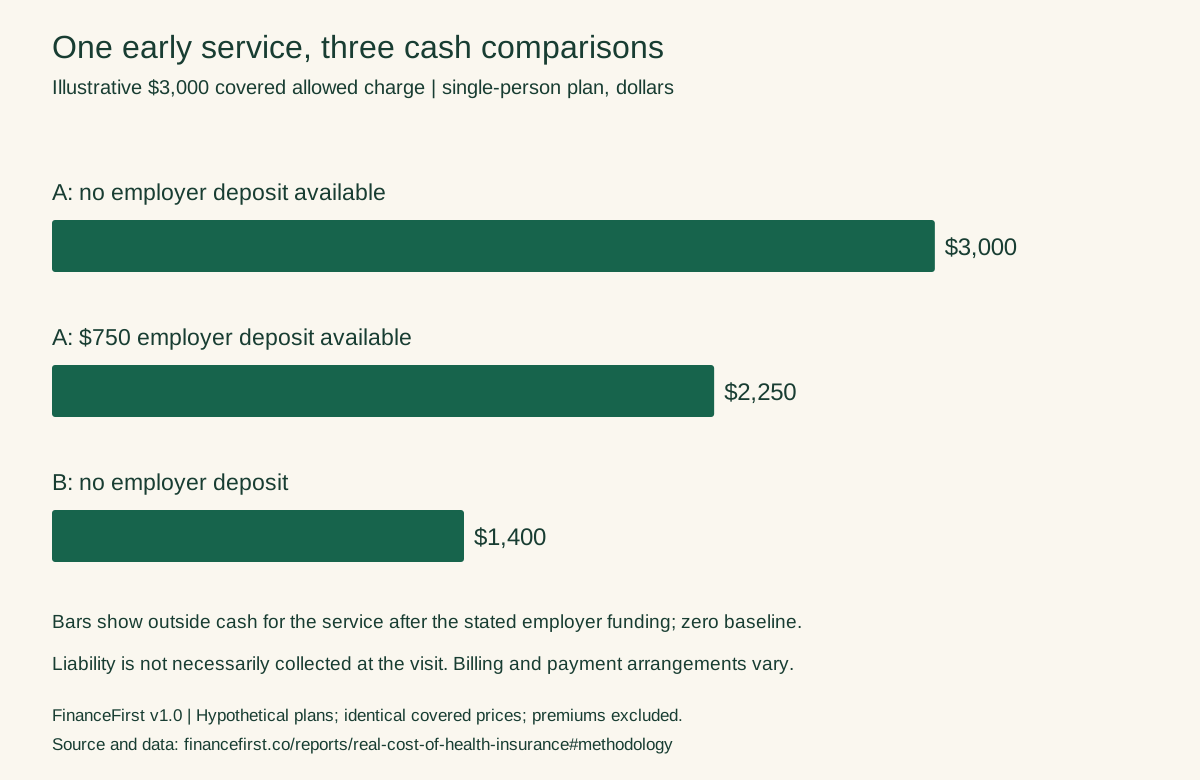
Consider an early $3,000 covered allowed-charge service, with neither deductible met. A assigns the full $3,000 to the worker. B assigns $1,400: a $1,000 deductible plus 20% of the next $2,000. A therefore assigns $1,600 more service liability.

If A's $750 employer HSA deposit is already available and used for this eligible expense, outside cash falls to $2,250. That is still $850 more than B's $1,400. If the employer deposits gradually or later, the full benefit is not yet available.

For the corresponding $3,000 full-year scenario, A's funding-adjusted annual cost is $4,410 versus B's $4,760, again $350 lower. Annual economics and the early service can therefore point in different directions. The $100 monthly premium difference is saved over time; it is not automatically in the bank at the first appointment.

Service-only cash testLiabilityEmployer funds availableOutside cash
A: no deposit yet$3,000$0$3,000
A: full deposit available$3,000$750$2,250
B$1,400$0$1,400

Liability does not mean a provider necessarily demands payment at the visit. Claims processing, billing dates and payment arrangements affect when money is due. This test excludes premiums and does not forecast those dates.

Compare plausible early liabilities with funds available after essential commitments. Do not reserve the same emergency dollars in full for medical bills, rent and a car repair simultaneously.

The employer deposit calendar can widen the January cash gap

The $750 employer contribution is not automatically in the account on January 1. Some employers front-load the full amount; others deposit it over pay periods. “Pro-rata vesting” is a misleading label for HSA deposits: once a contribution is credited, the HSA belongs to the employee. What changes is when the money arrives.

For a concrete schedule, divide $750 into 26 equal deposits, one every two weeks. That is $28.85 per paycheck (rounded). Assume one dependent has a $3,000 covered, deductible-subject service in January and the employer deposit is credited before the bill is due. Plan A’s modeled service liability is $3,000; Plan B’s is $1,400.

Plan A deposit timingEmployer HSA availablePlan A outside cash for $3,000 serviceCompared with B’s $1,400 liability
Front-loaded seeding: full amount Jan 1$750.00$2,250.00$850 more
One of 26 deposits credited$28.85$2,971.15$1,571.15 more
Two of 26 deposits credited$57.69$2,942.31$1,542.31 more

This isolates employer funding; it assumes no personal HSA balance or other savings and excludes premiums. If a deposit lands after the expense or payment date, it cannot fund that earlier cash need. Claims and provider billing may take longer, so the table does not predict when payment is demanded. Check the employer’s actual contribution schedule and your account balance before counting future deposits as available cash.

The annual model can still favor A after all $750 arrives. A gradual deposit schedule creates a temporary cash deficit at the moment care is used. The $100 monthly premium difference also accrues over the year; it is not an immediate January reserve.

The early service can need more cash under A

Hypothetical single-person service: $3,000 covered allowed charge before deductibles. Outside cash after specified available employer funding; premiums and payment due dates excluded. Not necessarily collected at the visit.

Outside cash for serviceService-only dollars
  1. A: no deposit yet
    Outside cash for service: 3,000 USD
  2. A: full $750 deposit
    Outside cash for service: 2,250 USD
  3. B: no deposit
    Outside cash for service: 1,400 USD
View chart data
The early service can need more cash under A
Period or categoryOutside cash for service
A: no deposit yet3,000 USD
A: full $750 deposit2,250 USD
B: no deposit1,400 USD
Source: FinanceFirst v1.0 service-only model; inputs and limitations

Your own HSA transfer is not an employer subsidy

A hand compares a plain medical bill, a savings envelope and a calendar on a kitchen desk.
FinanceFirst AI-assisted editorial illustration: the date a bill arrives can matter alongside the annual cost.

An employer deposit adds a resource. Moving your own money into an HSA does not make the underlying medical expense disappear. Do not subtract your whole personal contribution as if someone else paid it; calculate any applicable tax benefit separately.

The IRS explains that HSA funds can remain until used, stay with the owner after a job change, and support tax-free distributions for qualified expenses. We use the 2025 edition of Publication 969 only for those general principles, not current-year limits or a complete eligibility summary. Source: IRS, “What are the benefits of an HSA?”

Our $750 subtraction assumes the full employer deposit has been received and belongs to the worker. It is counted once. An unused HRA reimbursement allowance should not automatically be treated as the same owned, portable asset. No tax savings are included in the base model; the separate payroll-tax illustration appears in the annual comparison.

For separate eligibility and contribution considerations, read FinanceFirst’s HSA guide. A low premium or high deductible alone does not establish HSA eligibility.

Check access first, then complete the household worksheet

Ask for each plan's Summary of Benefits and Coverage, which presents standardized benefit information and coverage examples. It is a comparison document, not a personalized spending forecast. HealthCare.gov explains how to obtain an SBC.

Confirm your clinicians, facilities, prescriptions, relevant authorizations and exact network before comparing totals. Review the benefit year and reset dates, separate drug rules, and any family deductible structure. Official plan-comparison guidance and FinanceFirst’s health coverage and network guide provide the broader context.

Worksheet fieldWhat to collect
Coverage tier and periodActual offered tier, people covered and months enrolled
PremiumsRequired amount per deduction × actual deduction count
Planned careDefined services and prescriptions, priced under each plan
Low-use caseA named small set of services, not an unspecified “healthy” year
High covered-use casePremiums + applicable maximum, with exclusions listed
Employer fundingAccount type, amount, conditions and deposit schedule
Early cash testPlausible service before deposits and savings accumulate
AccessExact network, formulary, facilities and approvals

A $200 deduction taken 26 times is $5,200 a year. It is not $2,400. Use the actual payroll calendar, including any months without deductions.

Do not multiply this one-person model by family size. Embedded individual limits and aggregate family rules can change how expenses accumulate. For Marketplace plans, use your own eligibility-based assistance and cost-sharing terms; employer survey averages do not estimate those prices.

If the economic estimates are close, preserving necessary access or avoiding an unaffordable early liability may matter more than a small modeled saving. The worksheet makes that trade-off explicit. For building the cash reserve, see how to set an emergency-fund target.

Family deductible rules change whose spending unlocks coverage

Do not multiply the one-person model by the number of family members. Read both the individual and family deductible rows in the Summary of Benefits and Coverage (SBC), then confirm the policy or plan document. “Embedded” and “aggregate” describe different ways covered deductible spending accumulates; exact terms and exceptions vary by plan. HealthCare.gov notes that family plans often carry both individual and family deductibles. See the deductible glossary and CMS’s SBC and glossary guidance.

Illustration only: the family deductible is $6,000; an embedded individual deductible is $3,000; coinsurance is 20% after the applicable deductible. One dependent has $5,000 in January allowed charges, all subject to the deductible. No other family member has spending.

Family ruleMechanics and $5,000 January example
EmbeddedThis member reaches their $3,000 deductible first. The next $2,000 is at 20% coinsurance; others keep accumulating toward the $6,000 family deductible. Liability: $3,000 + 20% × $2,000 = $3,400.
AggregateAll members’ deductible-subject spending feeds one $6,000 threshold. Before the family reaches it, the member remains under the deductible in this example. One dependent’s $5,000 January charges leave $5,000 liability.

Here the aggregate rule requires $1,600 more cash for the same early event. A dependent’s major January event can make the Early-Bill Test much harder because the household has had little time to build reserves or receive scheduled employer deposits. It is a sharper early cash exposure, not an exponential one. The example excludes services covered before the deductible, copays, separate drug deductibles, and other plan terms; it is not a prediction for every family plan. Review the exact deductible and out-of-pocket limits for each person and the family in the SBC and governing plan document.

For readers, journalists and researchers

Download the complete comparison package, scenario dataset, early-service cash data, selected published observations, or reproduction script. The package includes editable inputs, formulas and scope notes. The CSVs are not KFF respondent data.

Chart downloads: annual comparison SVG and early bill SVG. Each contains its units, hypothetical label, version and source route. Accessible values appear in the tables above.

Citation-ready finding: Under FinanceFirst's two invented single-person plan designs, A costs $350 less at $10,000 of covered allowed charges after received employer HSA funding, while assigning $1,600 more liability for an early $3,000 service. Keep the hypothetical qualification when quoting it.

Suggested citation: FinanceFirst. The Real Cost of Health Insurance: Premiums, Care and the Early-Bill Test. Report version 1.1; data package version 1.0. Research cutoff November 7, 2026. Report and methodology. Use the publication date displayed in the report header. Corrections and reuse questions: FinanceFirst contact page.

Downloads are governed by FinanceFirst’s existing terms. Underlying KFF data and official guidance remain attributable to their publishers and are not relicensed by FinanceFirst. Generated editorial illustrations are separate from measured evidence.

Methodology and limitations

Scope. A sourced evidence synthesis and deterministic scenario analysis, not a new survey, actuarial forecast, insurer ranking or original interviews. KFF's survey covers non-federal public/private employers with at least 10 workers: 1,937 interviews, January–July 2026, 11% overall response. Most major estimates weight covered workers. Sampling and nonresponse uncertainty apply. KFF survey methods.

Formula. For covered allowed charges X, deductible D, member coinsurance c, applicable maximum M, annual worker premiums P and received employer HSA funding E: S(X) = min(M, min(X,D) + c × max(X−D,0)). Gross comparison = P + S(X). Funding-adjusted economic cost = P + S(X) − E. S includes applicable deductible spending; it is not added again.

Assumptions. The base model covers one person for 12 months at identical covered prices. The family deductible and tax examples are separate illustrations, not inputs to the base model. No probability distribution is claimed. The tax illustration assumes self-only Plan A HSA eligibility all year; the $750 employer contribution plus $3,650 worker contribution reaches the 2026 $4,400 limit; both plans’ premiums are pre-tax cafeteria-plan payroll deductions; the Plan A HSA contribution is a Section 125 salary reduction; federal marginal income tax is 22%; and all relevant wages face 7.65% employee FICA. It excludes state tax and individual eligibility or tax details. No tax effect is added to the charts or base scenario downloads. The family example assumes a $6,000 aggregate, $3,000 embedded individual deductible, 20% coinsurance, and deductible-subject covered charges. Actual plan rules vary. The base model excludes copays, separate pharmacy benefits, fees, investment returns, partial-year coverage, network differences and excluded care. Early cash excludes premiums and billing dates.

Reproducibility. Raw aggregate transcriptions and chosen hypothetical inputs are separate from derived outputs. The Python standard-library script rebuilds the CSVs and SVGs, checks every whole-dollar charge from $0 through $50,000 for bounds and monotonicity, and verifies caps, the tie and selected rows with independent piecewise arithmetic. The added examples do not change those inputs or outputs.

Editorial transparency. Prepared with AI assistance and checked against the linked original sources. No separate human, clinical, actuarial or independent reviewer approval is claimed. This is report version 1.1; the scenario dataset and chart calculations remain version 1.0. Recheck after KFF's next annual release or correction, a material official-guidance change, or a change in scenario inputs. Record substantive corrections without refreshing dates for freshness alone.

Sources and data references

  1. KFF, 2026 Employer Health Benefits Survey (October 22, 2026)

    2026 family premiums and worker contributions, Figure C; survey methods. Aggregate observations, not insurer quotes.

    Accessed 2026-11-07
  2. HealthCare.gov: total costs for health care

    Undated official guidance: premium, deductible and coinsurance framework.

    Accessed 2026-11-07
  3. HealthCare.gov: out-of-pocket maximum/limit

    Covered in-network maximum and exclusions. Annual statutory dollar limits are not used.

    Accessed 2026-11-07
  4. HealthCare.gov: Summary of Benefits and Coverage

    Standardized summaries for individual and job-based plans.

    Accessed 2026-11-07
  5. IRS Publication 969 (2025): Health Savings Accounts

    2025 edition; general retained-funds, ownership and qualified-distribution principles only. No current-year limits claimed.

    Accessed 2026-11-07
  6. HealthCare.gov: comparing health insurance plans

    Benefits, networks and total-cost comparisons; not a quote source.

    Accessed 2026-11-07
  7. IRS Publication 15 (2026): Employer tax guide

    Section 125 HSA salary reductions and federal payroll-tax exclusion; different treatment for non-cafeteria payroll deductions.

    Accessed 2026-11-07
  8. HealthCare.gov: deductible glossary

    Definitions of individual and family deductibles; family plans often have both.

    Accessed 2026-11-07
  9. CMS: Summary of Benefits and Coverage and Uniform Glossary

    Standardized plan comparison and glossary; confirm the governing plan terms.

    Accessed 2026-11-07

Questions and answers

Is the $28,303 family premium the worker’s bill?

No. KFF’s 2026 figure includes employer and worker premiums; the mean worker contribution is $7,471. It does not include all costs of using care.

Should I add my deductible to the full out-of-pocket maximum?

For applicable covered in-network spending, the deductible generally accumulates toward the relevant maximum. Adding both in full would double-count that spending. Premiums and excluded expenses remain separate.

Which hypothetical plan is cheaper?

At $10,000 in modeled covered allowed charges, A is $350 lower after its assumed $750 employer HSA funding. Before funding B is $400 lower. At $50,000 after funding B is $50 lower. These examples are not real offers.

Is the $20,250 break-even a rule for my health plan?

No. It applies only to the exact invented terms shown here. Different premiums, employer deposits, prices or benefit rules can move or eliminate the tie.

Can the cheaper annual option still need more cash early?

Yes in this illustration. At an early $3,000 covered service, A assigns $3,000 liability and B $1,400. If A’s full $750 employer deposit is already available, A still needs $850 more outside cash. Premiums and billing dates are excluded from this service-only test.

For journalists: copy briefing & citation

Use the dated figures with their scope and source. Charts above include vector and CSV downloads. A scenario or survey response should not be described as a measured outcome for every household.

Asim Ahmad. “The Real Cost of Health Insurance: Premiums, Care and the Early-Bill Test.” FinanceFirst Research, version 1.1, November 7, 2026. https://financefirst.co/reports/real-cost-of-health-insurance