
FinanceFirst Research

Tariffs and Household Costs in 2026: What the Evidence Shows

From the customs bill to the shopping basket: observed prices, research findings and a transparent household worksheet.

By 24 min readEditorial standards
Download data ↓

A sourced review of 2026 tariff changes, who bears the costs, observed consumer prices and what household estimates can and cannot tell us.

Key figures 3 findings
Border cost is not household cost
Different measures

Keep legal duties, prices and causal estimates separate.

Price-data coverage
Through September

The 2026 calendar year is incomplete.

Illustrative household scenario
$128

Assumed price effects on a $4,400 basket, not a measured national estimate.

What the evidence can tell us

A tariff is collected at the border. The household consequence emerges later, through prices, product choices and the way businesses respond. A useful report follows that chain instead of assigning every family the same bill.

The strongest conclusion: recent studies find substantial costs on the U.S. side, but there is no defensible shortcut from a headline tariff rate to what every household paid during 2026. A February study used data through November 2025 and found nearly 90% of the border-level burden fell on U.S. firms and consumers. That is not a claim that consumers paid 90% at checkout. [4]

This report brings together implemented-policy records, observed prices and published research. FinanceFirst contributes an evidence comparison, transparent arithmetic and adjustable household scenarios. We have not conducted a new causal estimate of the national 2026 tariff burden.

Coverage: price observations through September 2026; selected policy developments through October 30; research reviewed November 2. The year is incomplete. The timeline is a reporting guide, not an exhaustive product-level tariff schedule.

Review schedule: weekly, with substantive revisions when new evidence warrants them. Last reviewed November 2, 2026. An unchanged review does not mean new data were released. Original publication: October 13, 2026; this revision adds later evidence and expanded methods.
Which tariffs changed in 2026?

Effective date / eventMeasureWhat a reader needs to know
Jan. 1China: scheduled Section 301 increasesSpecified non-EV lithium-ion batteries, graphite and magnets: 25%; specified masks: 50%; medical gloves: 100%. These are additional Section 301 rates, not final shelf-price changes. [10]
Jan. 15Covered semiconductors: 25%Narrow product coverage and substantial end-use exceptions. Do not apply the headline rate to all electronics. [11]
Feb. 20IEEPA ruling changes the policy frameworkThe Supreme Court ruling removed the challenged emergency-powers tariff basis. Separate Section 232 and 301 measures remained relevant. [20]
Feb. 24 to July 24Temporary Section 122 surcharge10% for the specified 150-day period, with product exclusions and rules governing interactions with other duties. [12]
Apr. 6Steel, aluminum and copper restructuringListed products and derivatives move to full-customs-value treatment, with annex-specific rates and exclusions. A rate on metal content differs from the same rate on the whole product. [13]
July 22Brazil Section 301 measureAdditional 25% on covered Brazilian goods. Exemptions and in-transit rules prevent a blanket all-goods interpretation. [14]
July 24Section 301 action across 60 economies10% or 12.5% framework, subject to exceptions, USMCA treatment and some formulas net of ordinary MFN duties. [15]
July 31 / Sept. 29Patented pharmaceutical measuresImplementation varies by company group. Agreements and country treatment matter; do not equate the headline ceiling with all prescription prices. [16]
Aug. 22 / Oct. 30Selected Canadian productsAdditional 50% Section 338 duties took effect after a suspension. The covered-product list changed again October 30; it is not a uniform duty on all Canadian goods. [17]
Oct. 28Robotics and machinery negotiationsThis proclamation directs negotiations and contemplates possible future remedies. It does not itself impose a new tariff rate. [18]
Jan. 1, 2027Deferred furniture-related increasesSpecified upholstered wooden furniture, cabinet and vanity increases belong to the future schedule, not the 2026 implemented increase count. [19]

The July action illustrates why rates cannot simply be added. For covered EU and Taiwan products, the notice uses a combined ordinary-MFN-plus-new-duty threshold of 10% where MFN is below it. For Japan, Korea and Switzerland, the corresponding threshold is 12.5%. Exemptions still apply. [15]

For a specific shipment, establish the HTS classification, origin, entry date, ordinary duty, Chapter 99 duties and relevant exclusions. Use the dated schedule, not a news headline. USITC published HTS Revision 22 on October 30. [24]

Prices rose in some shopping categories and fell in others

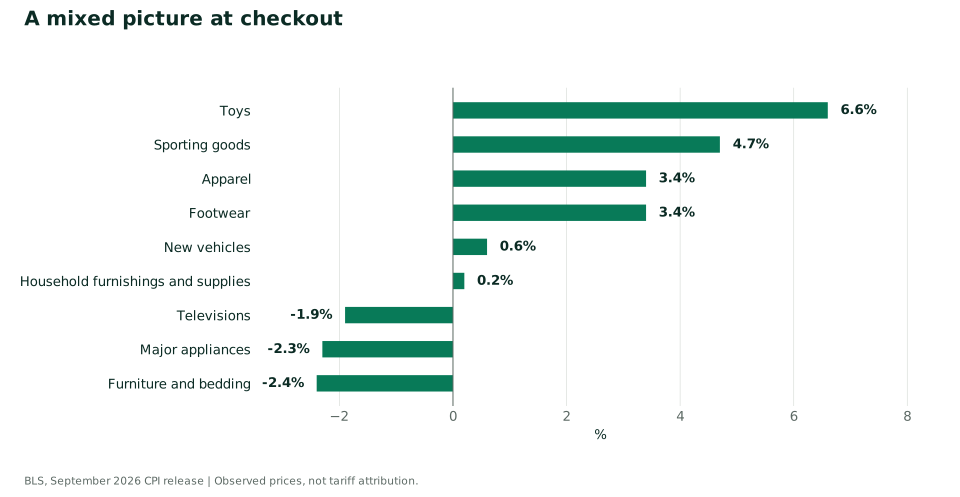
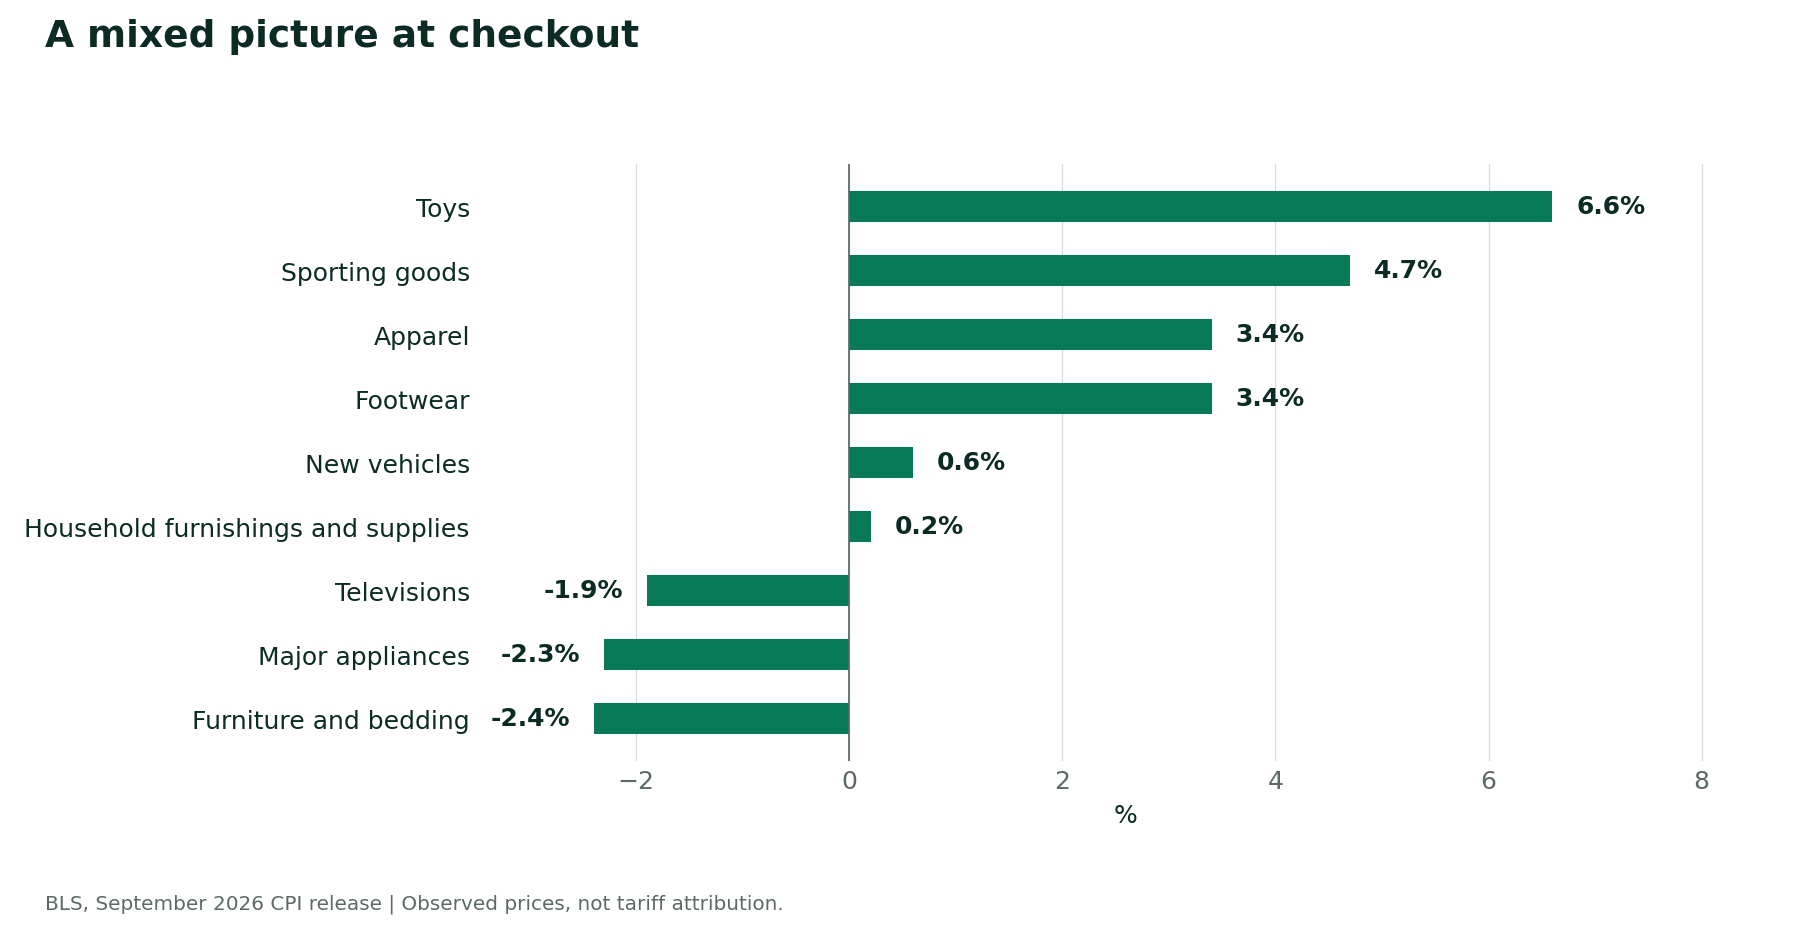
September CPI showed overall prices up 3.7% over a year and prices excluding food and energy up 2.6%. The selected categories below include both increases and decreases. They are observed inflation, not estimates of the portion caused by tariffs. [1]

Selected category12-month change
Toys+6.6%
Sporting goods+4.7%
Apparel+3.4%
Footwear+3.4%
New vehicles+0.6%
Household furnishings and supplies+0.2%
Televisions-1.9%
Major appliances-2.3%
Furniture and bedding-2.4%

These are September 2025 to September 2026 changes, not January-to-September changes. The selection follows the shopping categories discussed in this report; it is not an economy-wide ranking. Apparel and footwear overlap, as do the household categories. Do not sum them or average them into a household tariff estimate.

Download this chart (SVG) · Download this chart (PNG)

A mixed picture at checkout

BLS CPI-U, unadjusted 12-month changes to September 2026. Selected categories; not causal tariff effects.

Observed change%
  1. Toys
    Observed change: 6.6%
  2. Sporting goods
    Observed change: 4.7%
  3. Apparel
    Observed change: 3.4%
  4. Footwear
    Observed change: 3.4%
  5. New vehicles
    Observed change: 0.6%
  6. Household furnishings and supplies
    Observed change: 0.2%
  7. Televisions
    Observed change: -1.9%
  8. Major appliances
    Observed change: -2.3%
  9. Furniture and bedding
    Observed change: -2.4%
View chart data
A mixed picture at checkout
Period or categoryObserved change
Toys6.6%
Sporting goods4.7%
Apparel3.4%
Footwear3.4%
New vehicles0.6%
Household furnishings and supplies0.2%
Televisions-1.9%
Major appliances-2.3%
Furniture and bedding-2.4%
Source: BLS, September 2026 CPI release

Four numbers that answer four different questions

MeasureUseful forCannot establish alone
Tariff scheduleWhat duty legally applied to a shipmentA family’s annual cost
Calculated duties / import valueAn effective rate on the imports actually arrivingWhat businesses passed to customers
Retail price indexObserved price movementThe tariff-caused portion
Causal estimateChange relative to a defined alternativeAn exact amount on every household receipt

One easily missed issue: BLS import-price indexes exclude duties. An unchanged foreign supplier price can coexist with a higher duty-inclusive bill for the importer. [3] Nonfuel import prices rose 0.7% in September and 6.0% over the preceding 12 months. Those changes describe a different stage of the supply chain from CPI. [2]

Likewise, the federal fiscal year and calendar year are different periods. Fiscal 2026 runs October 2025 through September 2026. A fiscal-year customs total cannot be relabeled as money paid during calendar 2026. Treasury’s monthly receipts series is the fiscal source; this report does not calculate a receipts total. [23]

Who paid: compare the evidence without mixing the denominators

EvidenceFindingBoundary
New York Fed, February 2026Nearly 90% of border-level burden on U.S. firms and consumers. [4]2025 import data through November. Not the consumer share of customs receipts.
New York Fed Staff Report 1201About 26% pass-through coefficient; 64% of estimated consumer-price effect direct and 36% indirect. [5]Relative to less-exposed goods; aggregate conditions held fixed. Not a claim that firms absorbed 74% of duty dollars.
Federal Reserve household studyRetail coefficient about 0.15 using realized tariffs, or 0.20 with the authors’ exposure measure. [7]2025 transaction-panel evidence. Different exposure measures, coverage and outcomes make direct ranking misleading.
USITC historical analysisNear-full importer incidence; steel prices +2.4%, aluminum +1.6%. [8]Average effects during 2018-21. Historical evidence, not 2026 category estimates.

The October New York Fed explanation offers a useful conditional scenario: a uniform 10% tariff on all imports raises consumer-goods prices by an estimated 2.6% after twelve months. That is neither a measured 2.6% increase in all consumer prices during 2026 nor a rule for an individual purchase. [6]

The studies describe different samples, periods and price bases. Their coefficients should not be averaged into a single supposedly universal pass-through rate. These are authors’ research findings, not official Federal Reserve policy positions.

Why a 25% tariff need not mean a 25% price increase

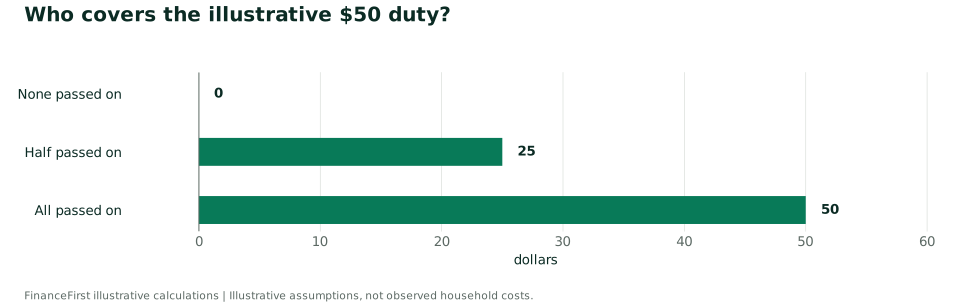
Consider an illustrative product with a $200 customs value and a $500 pre-tariff retail price. A new 25% duty adds $50 at the border, assuming the customs value does not change. If the entire $50 reaches the buyer, the shelf price becomes $550: a 10% retail increase even though all additional duty dollars were passed on.

Illustrative caseAdded dutyBuyer pays extraBusiness absorbsNew retail price
No pass-through$50$0$50$500
Half passed on$50$25$25$525
All passed on$50$50$0$550

This example holds supplier price, distribution costs, margins apart from absorption, quantity and other taxes constant. It is an explanation of denominators, not an estimate for a real product. Supplier discounts, exchange rates and sourcing changes would alter the arithmetic.

Another denominator trap: increasing a tariff from 10% to 25% raises duty-inclusive cost by 13.6%, at an unchanged pre-duty price: 1.25 ÷ 1.10 − 1. The tariff rose 15 percentage points, but the landed-cost percentage starts from a base that already included duty.

Download this chart (SVG) · Download this chart (PNG)

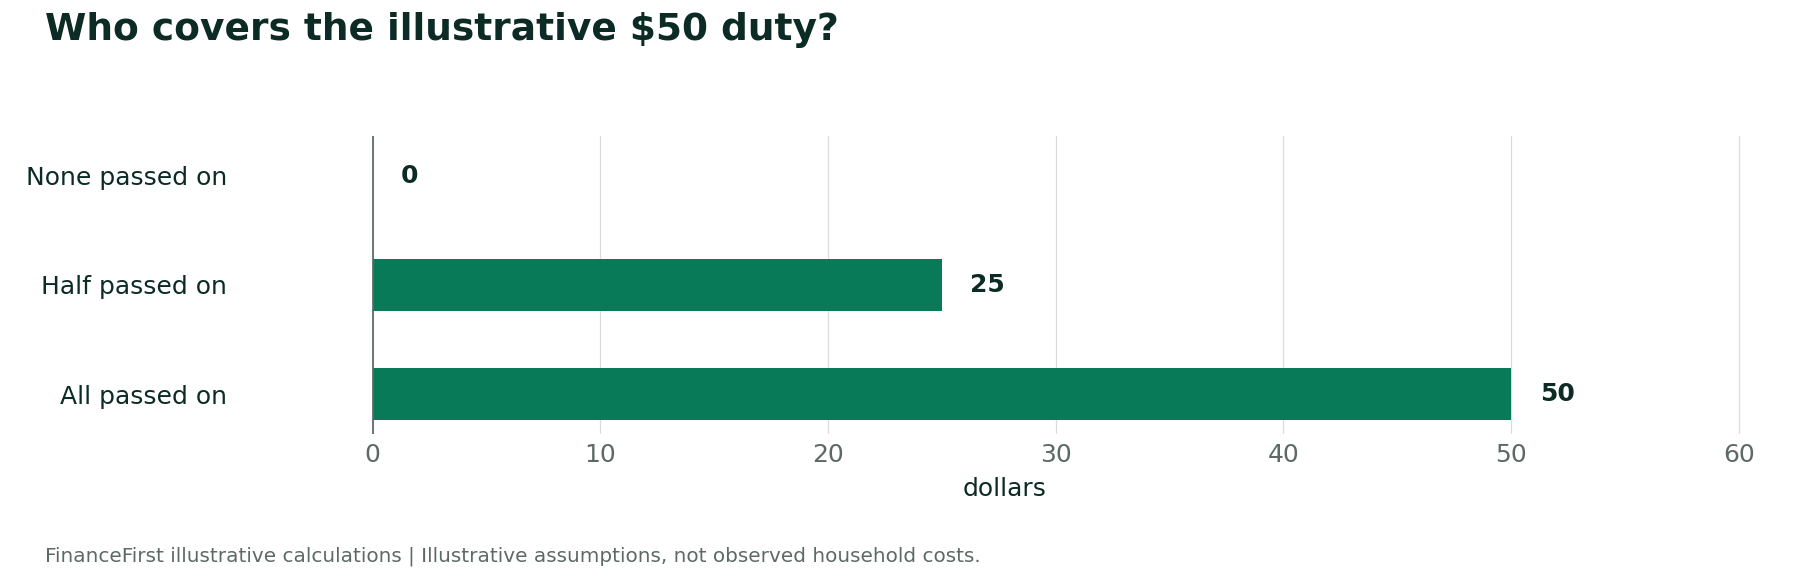
Who covers the illustrative $50 duty?

The chart shows the buyer’s extra payment. The business absorbs the balance under fixed-cost assumptions.

Illustrative valuedollars
  1. None passed on
    Illustrative value: 0 dollars
  2. Half passed on
    Illustrative value: 25 dollars
  3. All passed on
    Illustrative value: 50 dollars
View chart data
Who covers the illustrative $50 duty?
Period or categoryIllustrative value
None passed on0 dollars
Half passed on25 dollars
All passed on50 dollars
Source: FinanceFirst illustrative calculations

How to separate tariff effects from other inflation

A before-and-after price comparison is a starting point. It is not an identification strategy. Exchange rates, energy, freight, wages, demand and product changes can move prices at the same time.

The New York Fed study compares differently exposed goods while holding aggregate conditions fixed. It also traces imported inputs and domestic competition. [5] A new analysis should publish its own assumptions rather than borrowing that study’s credibility for an unrelated chart.

  1. Define the alternative. Is the comparison against January 2025 policy, January 2026 policy or no new tariff? Different baselines answer different questions.
  2. Date the exposure. Match product, origin and effective date. Keep a fixed pre-policy weighting measure alongside actual trade weights so sourcing changes do not disappear inside the average.
  3. Choose a comparison group. Check whether more- and less-exposed products had similar trends before the policy change. Domestic products may also be exposed through imported inputs.
  4. Account for competing explanations. Test exchange rates, energy and freight costs, seasonality, demand and product composition. Show sensitivity to the chosen controls.
  5. Allow time. Inventory purchased earlier and supply contracts can delay repricing. Do not assume the full effect arrived on the effective date.
  6. Report uncertainty. Publish confidence intervals, sample restrictions, data vintage and alternative specifications. A neat point estimate does not eliminate uncertainty.

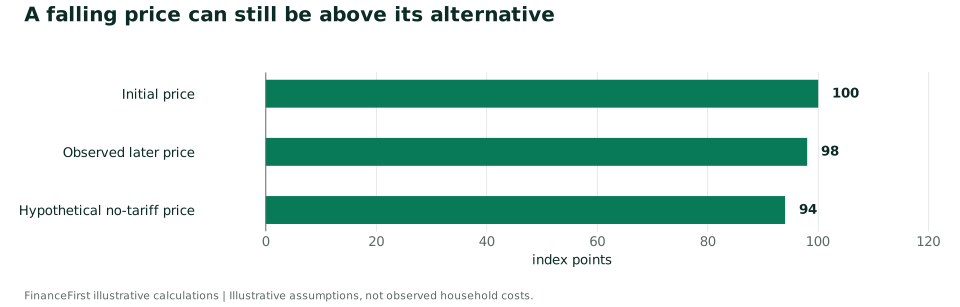
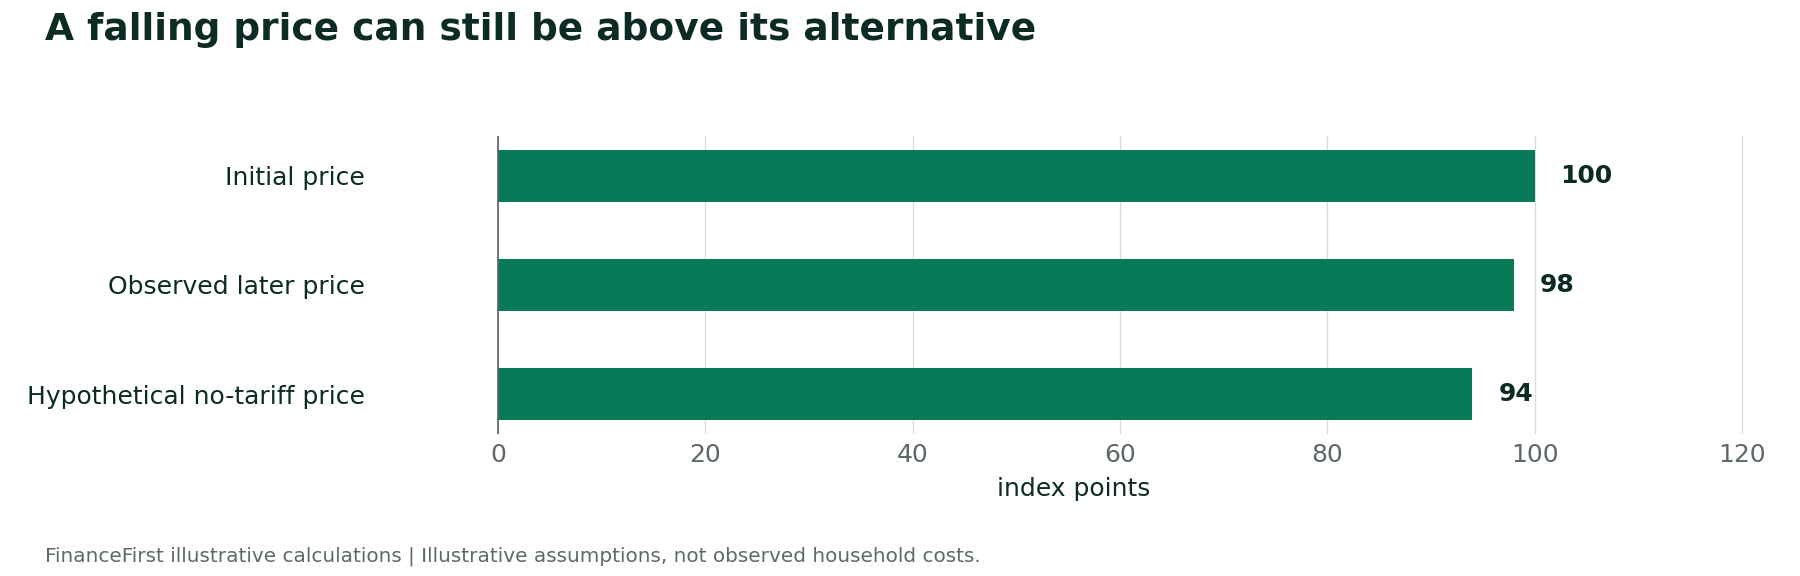
A price can fall while tariffs still make it higher than the alternative. If a hypothetical index falls from 100 to 98 but would have fallen to 94 without the tariff, the observed price is 4.3% above that counterfactual. Neither the 94 nor the tariff effect is directly observed in this illustration.

Download this chart (SVG) · Download this chart (PNG)

A falling price can still be above its alternative

Illustration only; hypothetical price index, initial value 100.

Illustrative valueindex points
  1. Initial price
    Illustrative value: 100 index points
  2. Observed later price
    Illustrative value: 98 index points
  3. Hypothetical no-tariff price
    Illustrative value: 94 index points
View chart data
A falling price can still be above its alternative
Period or categoryIllustrative value
Initial price100 index points
Observed later price98 index points
Hypothetical no-tariff price94 index points
Source: FinanceFirst illustrative calculations

What could it mean for a household budget?

Worked example only: $128 is not an estimate for the average U.S. household. The spending amounts and price changes below are invented to demonstrate the calculation. They are not survey findings or measured tariff costs.

Start with the spending actually exposed to a price change. Do not multiply a tariff rate by the household’s entire budget. Rent, imported shoes and a domestic appliance have different exposure paths.

Illustrative annual spendingBaselineAssumed tariff-caused price effectAdded fixed-basket cost
Clothing and footwear$2,4003%$72
Household goods$1,2002%$24
Electronics$8004%$32
Total$4,400Not a uniform rate$128 (hypothetical)

All inputs are invented scenarios, not national averages or measured 2026 tariff effects. At unchanged quantities, the arithmetic is $2,400 × 3% + $1,200 × 2% + $800 × 4% = $128. Spending less by buying fewer goods is a behavioral response, not proof that no burden occurred.

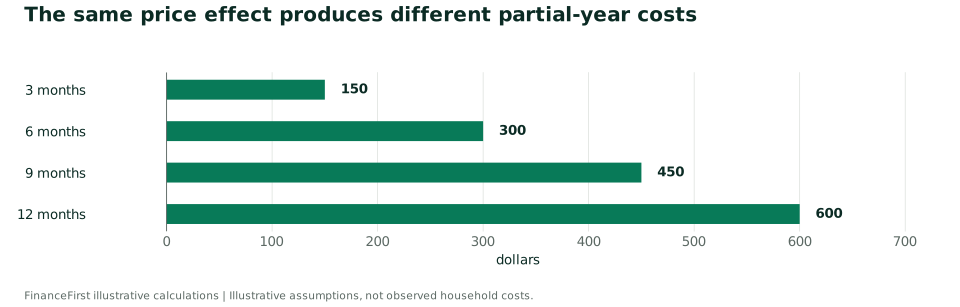
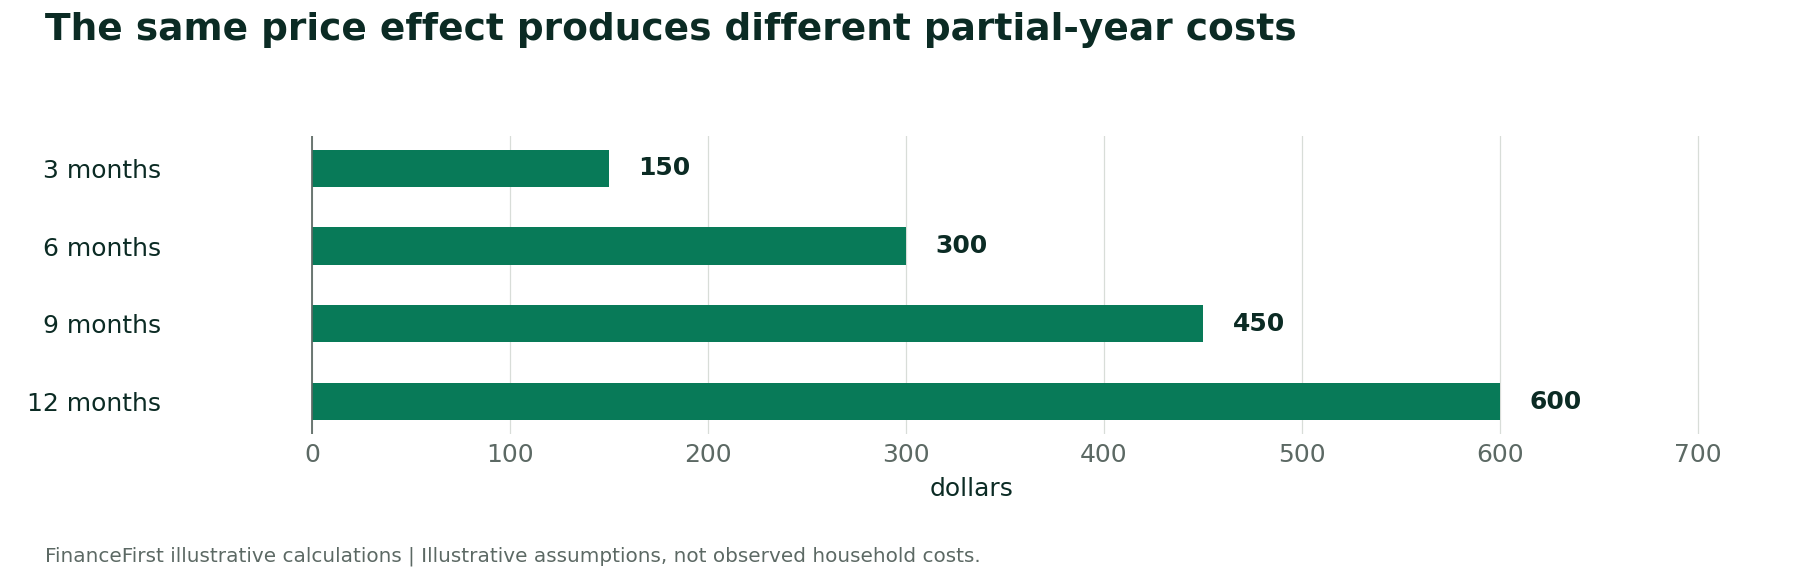
Timing also matters. A fully developed 1% price effect on a hypothetical $60,000 annual basket is $600 annualized. If it operates for only six months with evenly distributed purchases, this simplified calendar-year cost is $300. Real spending is seasonal and durable purchases are uneven, so adjust timing rather than treating this as a household forecast.

Use the worksheet below to change spending, the assumed price effect and months affected. It deliberately does not guess a tariff rate from your address or label the result “what you paid.”

Download this chart (SVG) · Download this chart (PNG)

The same price effect produces different partial-year costs

Illustrative $60,000 annual basket and 1% price effect; uniform spending and no behavioral change.

Illustrative valuedollars
  1. 3 months
    Illustrative value: 150 dollars
  2. 6 months
    Illustrative value: 300 dollars
  3. 9 months
    Illustrative value: 450 dollars
  4. 12 months
    Illustrative value: 600 dollars
View chart data
The same price effect produces different partial-year costs
Period or categoryIllustrative value
3 months150 dollars
6 months300 dollars
9 months450 dollars
12 months600 dollars
Source: FinanceFirst illustrative calculations

Try your own household scenario

Illustrative fixed-basket cost, not an estimate of what tariffs caused you to pay. Enter affected spending and an assumed consumer-price increase, not the tariff rate.

Only the spending exposed to your assumed price change.

A scenario assumption, not the tariff rate or total inflation.

Assumes spending is spread evenly through the year.

Illustrative additional cost during the selected period

$50.00

$10,000.00 × 1% × 6/12. Quantities held constant.

The average household hides very different experiences

The Federal Reserve transaction study finds a disproportionate welfare burden for lower-income households. It also identifies cutbacks in non-essential purchases and trading down within essentials. A transaction panel does not capture every household or every purchase, so it should not be presented as a complete national household ledger. [7]

For an individual reader, the practical questions are more concrete: Are you replacing a vehicle this year? Buying furniture? Can a repair defer a purchase? Is a cheaper substitute genuinely equivalent? A household making a major purchase can have concentrated exposure that an average smooths away.

A useful buying checklist: compare the same model and specifications, request an itemized final quote, include financing and delivery, and check price history before accepting a “tariff surcharge” explanation. A retailer’s label is not independent evidence of the cost it incurred. Avoid borrowing for a rushed purchase solely because a future price increase is possible.

For broader context, read our cost-of-living report and emergency-savings research. These measure different pressures and should not be added into a tariff total.

To compare the extra expense with your actual monthly cash flow, use FinanceFirst’s budget calculator. The spending guideline is a starting point, not a requirement.

A practical map of the official data

QuestionSource to start withResearch precaution
Which duties applied?HTS archive and implementation notices [24]Match classification, origin, entry date, exclusions and stacking.
What entered U.S. consumption?USITC DataWeb [21]Use imports for consumption for duty analysis. State whether the denominator is all customs value or only dutiable value.
Did foreign suppliers change prices?BLS import-price indexes [3]Duties are excluded. Add tariff exposure separately when analyzing landed cost.
What did shoppers face?BLS CPI detail [1]Match period, adjustment and category. Inflation alone is not causation.
How do tariffs enter domestic production?BEA national and industry accounts [22]Supply tables allocate import duties by commodity; do not equate imports with final household purchases.
What reached the federal government?Treasury monthly receipts [23]Distinguish fiscal from calendar periods, cash receipts from calculated duties, and receipts from welfare costs.

BEA records customs duties within taxes on production and imports. Its national-accounts import values exclude those duties, while supply tables identify their commodity allocation. That accounting distinction prevents double counting when tracing an imported input into a finished domestic product. [22]

How to judge a headline household-cost estimate

Ask for the policy snapshot, counterfactual, household definition, time horizon and pass-through assumption before comparing two dollar headlines.

The Budget Lab’s April 2026 retrospective explains why its earlier conditional 2025 forecast differed from later evidence: tariff policy changed, measurement improved and pass-through assumptions changed. A forecast based on an unchanged policy is not a receipt-based finding about what happened after that policy was revised. [9]

  • Year: publication in 2026 does not make the underlying observations 2026 data.
  • Population: a household, a consumer unit and a person are different denominators.
  • Outcome: higher fixed-basket cost, lower actual spending, lower real income and welfare loss are not interchangeable.
  • Timing: annualized impact is not automatically cost already incurred.
  • Fiscal effects: do not add tariff receipts to a consumer-cost figure that already incorporates the tariff-related price increase.
  • Revisions: preserve the release vintage and explain updates, rather than silently replacing earlier figures.

No single reviewed source establishes a precise, completed calendar-2026 cost for all American households. A full-year update must wait for the remaining observations and still explain the counterfactual.

The business angle: protection has customers downstream

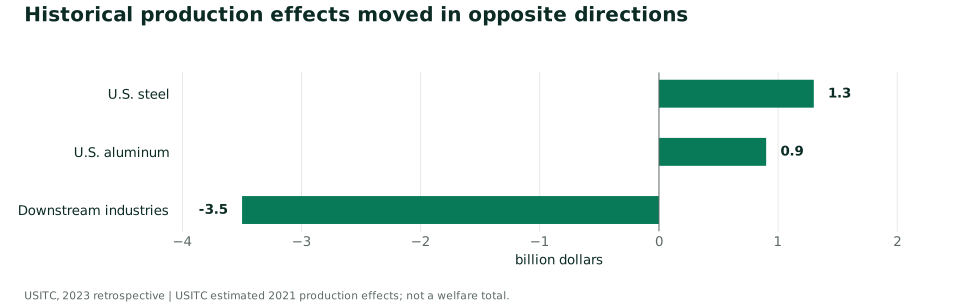
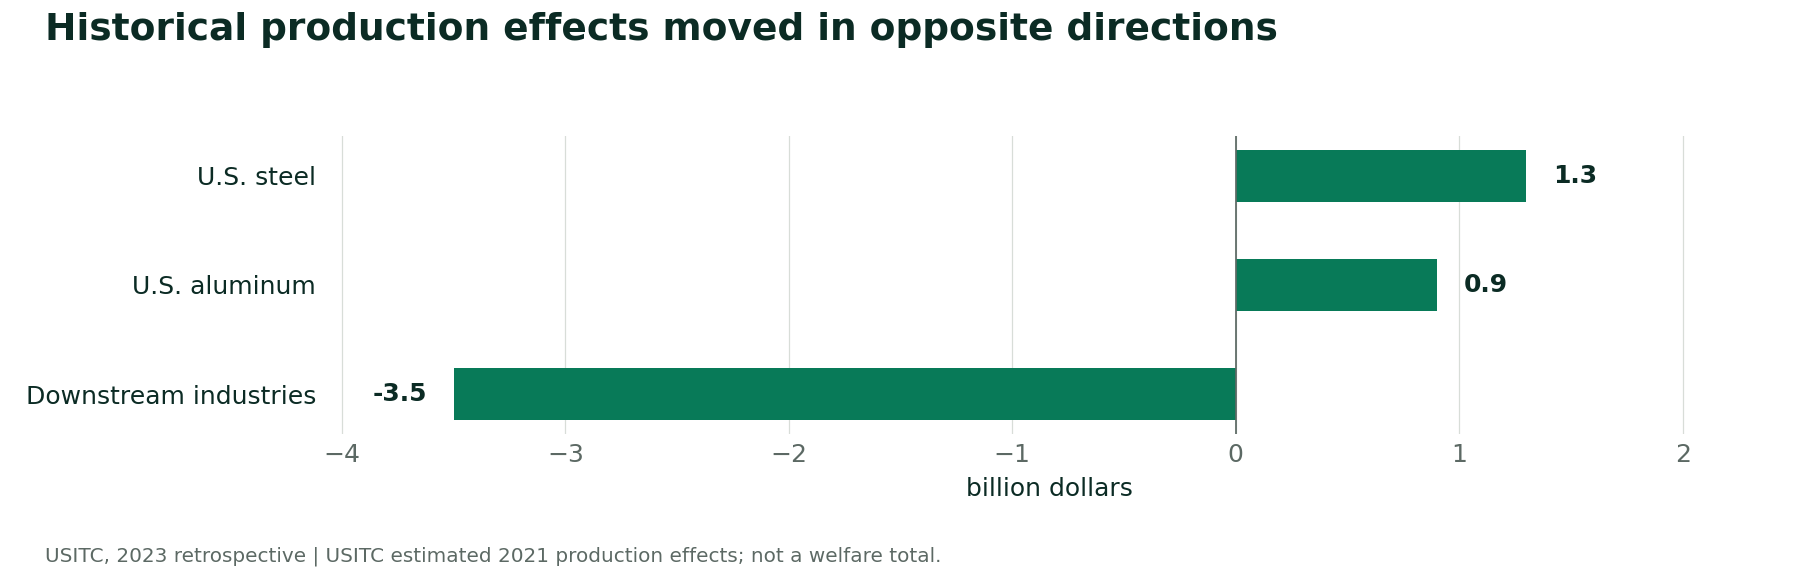
Tariffs can support some domestic producers while raising costs for businesses that buy their output. A retrospective USITC analysis estimated the following Section 232 production effects in 2021: steel +$1.3 billion, aluminum +$0.9 billion, and downstream industries -$3.5 billion. These are historical sector production effects, not profits, welfare, tax receipts or 2026 estimates. Do not subtract them to claim a complete net economic loss. [8]

For a manufacturer, the useful questions are whether the affected input can be substituted, how long supplier contracts last, how much inventory was bought before the tariff, and whether customers accept a price change. A shop selling domestically made goods can still face imported components or competing suppliers that reprice. A country-of-assembly label alone does not measure exposure.

Download this chart (SVG) · Download this chart (PNG)

Historical production effects moved in opposite directions

USITC estimates for 2021, billions of dollars. Selected sectors; not a net welfare calculation or a 2026 forecast.

Estimated production effectbillion dollars
  1. U.S. steel
    Estimated production effect: 1.3 billion dollars
  2. U.S. aluminum
    Estimated production effect: 0.9 billion dollars
  3. Downstream industries
    Estimated production effect: -3.5 billion dollars
View chart data
Historical production effects moved in opposite directions
Period or categoryEstimated production effect
U.S. steel1.3 billion dollars
U.S. aluminum0.9 billion dollars
Downstream industries-3.5 billion dollars
Source: USITC retrospective sector findings

How businesses and households adapt over time

The fixed-basket worksheet holds quantities and sourcing constant to make its arithmetic visible. Real buyers change both. A manufacturer can switch suppliers, redesign an input, use inventory, accept a smaller margin or raise prices. A household can change brands, repair a product or postpone replacing it. Paying less because a purchase was abandoned is not equivalent to being better off.

Substitution elasticity describes how strongly relative quantities respond to relative prices. A higher elasticity means buyers can switch more readily when one source becomes more expensive. It is not a universal number: a standard fastener and a certified, custom component face different replacement constraints. Contracts, testing, capacity and tooling can make substitution slow initially, even where alternatives eventually exist. A new supplier may avoid some duties while increasing freight, compliance or production costs.

Keep three clocks separate: the legal tariff date, the arrival of higher-cost inventory, and the date a replacement supplier is ready. Those clocks help explain why an initial price response can differ from the eventual response. Exchange rates and foreign suppliers' pre-duty prices can also move, so a tariff rate alone does not establish the change in landed cost. These mechanisms are consistent with the Dallas Fed's discussion of supplier switching, trade diversion and terms of trade; this report does not estimate a new elasticity or a 2026 dollar offset.

For a business comparison: record the original and replacement supplier's origin, customs value, applicable duties, freight, qualification costs, minimum order and lead time. Compare total delivered cost at the same quality and quantity. Moving a shipment through another country does not, by itself, change its legal origin.

Trace one input from the border to the checkout

Hypothetical illustration, not an observed appliance price or a claim about semiconductor coverage. Assume an imported component with a $100 customs value faces a new 25% duty. The importer pays $25. If it passes $20 to a domestic assembler and absorbs $5, and the assembler passes $12 of that $20 to the retailer, the assembler absorbs $8. If the retailer passes $9 to the buyer, it absorbs $3.

StageNew cost receivedPassed onwardAbsorbed at this stage
Importer$25 duty$20$5
Domestic assembler$20 input increase$12$8
Retailer$12 wholesale increase$9$3
Household$9 retail increaseNot applicable$9 paid by buyer

The check is $5 + $8 + $3 + $9 = $25. Adding the successive $25, $20, $12 and $9 would count the same cost more than once. This stripped-down example excludes changing quantities, markups, exchange rates and other inputs. It is a cost-allocation illustration, not a welfare calculation.

Domestic sales do not automatically create another customs duty at every stage. Separate border crossings or overlapping tariff programs can create additional legal liabilities, but those require the actual classification, origin, valuation and stacking rules. The January semiconductor measure has narrow coverage and exceptions; it cannot be assumed to apply to an appliance's ordinary chip.

The New York Fed study identifies indirect effects through imported inputs and domestic markups, with slower transmission than the direct import channel. Its estimated nine-to-twelve-month indirect adjustment is a study result, not a promised delay for this invented product path.

Why tariff revenue is not the same as an economic gain

A customs receipt is revenue for government and a payment by the importer. When domestic households and firms ultimately bear that payment, part of their loss is a transfer within the domestic economy. Adding revenue to consumer costs as though both were separate losses would double count that transfer. The CBP's 2025 proposed-rule economic analysis, pages 25-26, explicitly distinguishes consumer-surplus losses from tariff revenue in its welfare accounting. That document is a methodological example, not a measurement of 2026 welfare.

In the standard small-country model, where foreign prices are unchanged, tariff revenue and domestic producer gains offset part of the gross consumer loss. Inefficient extra domestic production and lost mutually beneficial purchases leave a residual deadweight loss. Rebating revenue does not automatically eliminate that residual. Who receives a rebate also matters: an equal payment need not compensate households with different spending patterns.

For a large importing country, foreign suppliers may reduce pre-tariff prices, creating a terms-of-trade benefit. Its size depends on substitution possibilities and can be reduced by retaliation. The Dallas Fed's model discussion assumes lump-sum household rebates and limited retaliation; those are modeling assumptions, not proof that actual households received a tariff refund.

How receipts affect aggregate demand depends on whether government spends them, transfers them, cuts other taxes or reduces borrowing, and on the timing and responses of households and monetary policy. We therefore do not subtract Treasury receipts from a household-price scenario or report a new net 2026 welfare total.

How much does the household assumption matter?

Annual exposed spending0.5% price effect1% price effect2% price effect
$5,000$25$50$100
$10,000$50$100$200
$20,000$100$200$400

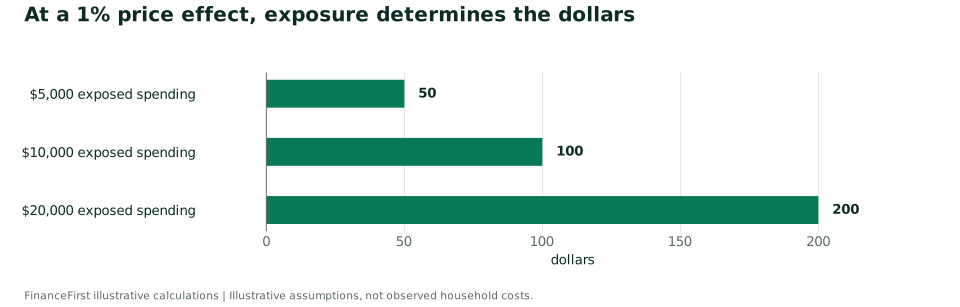
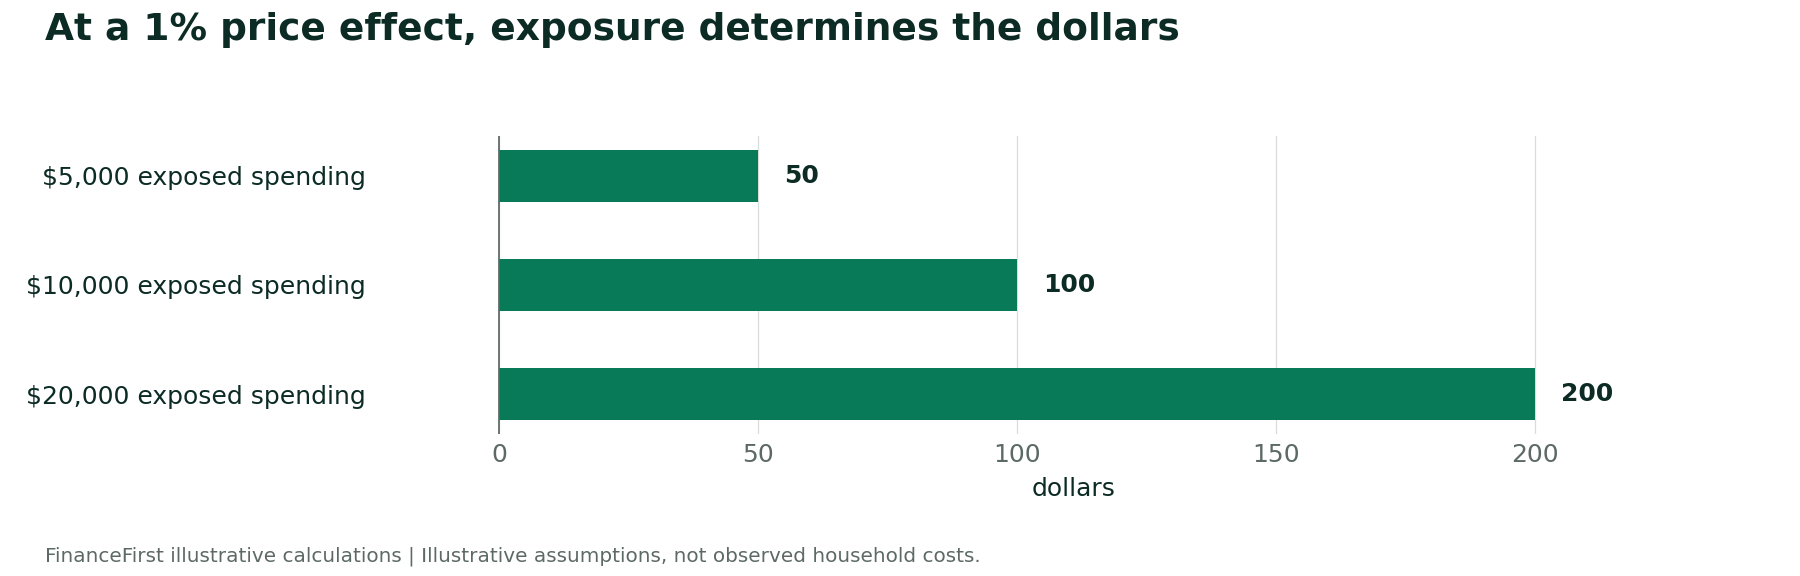
This is a sensitivity table, not a forecast. Each cell holds quantities constant and applies its assumed price effect for 12 months. It covers only the spending entered, not all income. At $10,000 of exposed spending, changing the assumption from 0.5% to 2% changes the result from $50 to $200. For six months of evenly distributed spending, halve each amount.

A household that spends $10,000 on the affected basket and one that spends $20,000 should not receive the same dollar estimate. Equally, neither should automatically apply a border tariff rate to its entire annual budget. Use a separately supported consumer-price assumption and state its source.

Download this chart (SVG) · Download this chart (PNG)

At a 1% price effect, exposure determines the dollars

Illustrative 12-month fixed basket. Not measured tariff costs; no quantity response.

Illustrative valuedollars
  1. $5,000 exposed spending
    Illustrative value: 50 dollars
  2. $10,000 exposed spending
    Illustrative value: 100 dollars
  3. $20,000 exposed spending
    Illustrative value: 200 dollars
View chart data
At a 1% price effect, exposure determines the dollars
Period or categoryIllustrative value
$5,000 exposed spending50 dollars
$10,000 exposed spending100 dollars
$20,000 exposed spending200 dollars
Source: FinanceFirst illustrative calculations

A reusable checklist for reporting a tariff-cost number

  1. Name the outcome: customs payments, import prices, retail prices, spending or welfare.
  2. State the period: calendar or fiscal year, observed months, and whether the figure is annualized.
  3. Identify the policy: rate, effective date, product coverage, exemptions and whether it is implemented or proposed.
  4. Show the denominator: customs value, retail spending, household count or income.
  5. Separate observation from attribution: identify the comparison case and competing explanations.
  6. Keep uncertainty visible: show assumptions, revisions and alternative scenarios beside the headline.

Copy-ready methodology note: “FinanceFirst compared dated tariff records, published price observations and research estimates. Observed CPI changes are not assigned wholly to tariffs. Household examples use explicit fixed-basket assumptions and are not a measured national bill.”

Request for a business interview: Ask for comparable invoices before and after the change, customs classification, entry dates, duty statements, quantities, freight charges and any supplier discount. Redact confidential details before sharing. A surcharge label by itself cannot establish pass-through.

Eight direct answers for reporters

QuestionConcise answer
1. Which tariffs changed?Use the dated timeline above. It includes scheduled China increases, semiconductors, temporary Section 122 duties, metals, Brazil, the 60-economy action, pharmaceuticals and Canadian changes. Future or negotiation-only measures are labeled separately.
2. Which official data?Combine HTS/implementation records, USITC trade and calculated duties, BLS import prices and CPI, BEA supply accounts and Treasury receipts. No one series measures household tariff cost.
3. How to isolate tariffs?Compare product exposure against a defined counterfactual, check pre-trends, allow lags and test competing explanations. A before-and-after CPI chart does not do this.
4. Which products changed most?The selected shopping-category table shows mixed changes. It does not rank tariff-caused effects; that requires a comparable causal design across categories.
5. What share was passed on?There is no universal share. First specify the price base, period and stage of the supply chain. Percentage coefficients are not a division of customs receipts.
6. Who ultimately paid?The reviewed border research finds most of the burden on the U.S. side. Retail and household studies explain why the split within that side depends on timing and behavior.
7. A household example?The explicitly hypothetical $4,400 basket above costs $128 more under its stated price assumptions and unchanged quantities.
8. What are the limits?Incomplete year, policy revisions, delayed repricing, changing quantities, unequal baskets, data revisions and the unobserved alternative prevent a simple national receipt total.

These answers summarize the sourced sections above. Attribute FinanceFirst’s synthesis to Asim Ahmad, FinanceFirst. Attribute study estimates to the named researchers. Do not describe this report as an economist interview or a newly estimated national causal study.

“A tariff rate, a customs receipt and a household cost are different measurements. Good reporting explains the bridge between them.”

Suggested citation: Ahmad, Asim. Tariffs and Household Costs in 2026: What the Evidence Shows. FinanceFirst, Reviewed November 2, 2026. https://financefirst.co/reports/tariffs-household-costs-2026.

For journalists: request a free custom analysis

Cannot find the category, geography or comparison you need? Request a free custom analysis from FinanceFirst, or use our contact page. We welcome specific report requests and can assess what the available public data can support.

Include your publication, deadline, question, geography, product or industry, comparison period and preferred output, such as a chart, source check or downloadable table. We will confirm scope and feasibility before committing to delivery. Some questions cannot be answered reliably with the available data.

Contact: info@financefirst.co. Editorial lead: Asim Ahmad, Founder and Editor. See our media resources for attribution and other research. Cite the underlying study for its estimates and FinanceFirst for this synthesis or any clearly identified original calculations.

Methodology and limitations

Evidence synthesis with illustrative calculations, version 1.2, reviewed November 2, 2026. CPI figures preserve the published unadjusted September-to-September percentages. Category selection is purposive and includes overlapping aggregates; no category average or causal ranking is calculated. Research coefficients retain their original study context. The policy inventory is selective and combines dated notices with a September 30 CRS baseline and October updates.

Scenario formulas: incremental duty = customs value × (new rate − old rate); buyer increment = incremental duty × assumed pass-through fraction; fixed-basket cost = annual spending × assumed price effect × months affected ÷ 12. These formulas hold the stated bases constant and do not estimate behavioral, exchange-rate, distributional, legal-stacking or general-equilibrium responses. All scenario inputs are assumptions. The counterfactual example uses 98 ÷ 94 − 1 = 4.2553%, rounded to 4.3%.

No proprietary transaction data were obtained, no new econometric model was estimated and no full-year 2026 household total was calculated. An unavailable Congress.gov page was checked through the identified CRS mirror; original implementation notices are linked separately. This is a dated evidence snapshot. Later releases and policy changes may supersede these observations.

The added supply-chain example allocates a hypothetical $25 duty across three firms and a household; it does not add a fresh duty at each domestic sale. Supplier substitution and welfare discussion are conceptual extensions supported by the linked research, not newly estimated 2026 effects. Original publication date October 13, 2026 was confirmed by the publisher; this expanded revision was reviewed November 2, 2026.

Sources and data references

  1. BLS, September 2026 CPI release

    October 14 release. Table A and Table 2. Unadjusted 12-month changes, September 2025 to September 2026; not tariff-attributable changes.

    Accessed 2026-11-02
  2. BLS, September 2026 import prices

    October 16 release. Nonfuel import prices: +0.7% monthly, +6.0% over 12 months. Duties excluded.

    Accessed 2026-11-02
  3. BLS import-price methodology FAQ

    Question: Do the Import/Export Price Indexes include import duties?

    Accessed 2026-11-02
  4. Amiti et al., Who Is Paying for the 2025 U.S. Tariffs?

    February 12, 2026. Import data through November 2025. Nearly 90% U.S. incidence at the border; not a household checkout share.

    Accessed 2026-11-02
  5. Amiti, Heise and Weinstein, The Anatomy of Tariff Pass-Through into Consumer Prices

    Staff Report 1201, revised September 2026. Relative-exposure estimates, aggregate conditions held fixed. 26% coefficient; direct 64%, indirect 36%.

    Accessed 2026-11-02
  6. Amiti, Heise and Weinstein, How Fast Do Tariffs Pass Through into Consumer Prices?

    October 6, 2026. Illustrative uniform 10% tariff scenario gives 2.6% consumer-goods price increase after 12 months; not actual all-item 2026 inflation.

    Accessed 2026-11-02
  7. Hacıoğlu Hoke and Feler, Paying More and Buying Less

    Revised August 2026; corrected PDF posting September 29. 2025 transaction-data study, not a completed 2026 household account.

    Accessed 2026-11-02
  8. USITC retrospective sector findings

    March 15, 2023. Average 2018-21 effects; steel prices +2.4%, aluminum +1.6%. Historical comparison only.

    Accessed 2026-11-02
  9. Budget Lab, One Year of Tariff Analysis

    April 2026 retrospective explains divergence between conditional 2025 forecast and later evidence. Not a new 2026 household-cost estimate.

    Accessed 2026-11-02
  10. USTR final China Section 301 modifications

    Final September 2024 notice; scheduled January 2026 changes. Use final rates, not proposed rates.

    Accessed 2026-11-02
  11. Semiconductor proclamation

    Covered products and end-use exclusions; effective January 15, 2026.

    Accessed 2026-11-02
  12. Temporary Section 122 surcharge proclamation

    10% for 150 days beginning February 24, 2026, with exclusions and stacking provisions.

    Accessed 2026-11-02
  13. Metal tariff restructuring, FR 2026-06960

    Effective April 6; full customs value provision and product-specific annexes.

    Accessed 2026-11-02
  14. Brazil Section 301 action, FR 2026-14542

    Effective July 22; additional 25% with exemptions and transit provisions.

    Accessed 2026-11-02
  15. Section 301 action covering 60 economies

    Effective July 24; 10%/12.5% framework, net-of-MFN formulas, exceptions and annexes.

    Accessed 2026-11-02
  16. Pharmaceutical proclamation, FR 2026-06956

    Company-dependent July 31 and September 29 implementation; patented products, country arrangements and company agreements.

    Accessed 2026-11-02
  17. CBP CSMS 70314289, Canadian duty coverage update

    October 29 guidance. Duties began August 22 after suspension; covered-product changes effective October 30.

    Accessed 2026-11-02
  18. Robotics and machinery proclamation

    October 28 directs negotiations. Does not itself set a new tariff rate.

    Accessed 2026-11-02
  19. Timber and furniture amendment, FR 2026-00327

    Specified increases deferred to January 1, 2027.

    Accessed 2026-11-02
  20. CRS R49481, October 8 policy inventory (mirror)

    Government-authored inventory accessed via EveryCRSReport because Congress.gov was unavailable. Cutoff September 30; supplemented with October notices. Not exhaustive current shipment guidance.

    Accessed 2026-11-02
  21. USITC DataWeb

    Imports for consumption, customs value and calculated duties. Data dictionary distinguishes all-import and dutiable-value denominators.

    Accessed 2026-11-02
  22. BEA, How tariffs appear in the national accounts

    Customs duties in NIPA tables 3.5 and 3.5U; supply-table allocation by commodity. Imports exclude customs duties.

    Accessed 2026-11-02
  23. Treasury, Receipts and Outlays

    Monthly Treasury Statement publication and fiscal receipts resource. No customs-receipt total is calculated in this report.

    Accessed 2026-11-02
  24. USITC HTS revision archive

    Revision 22 published October 30, 2026. Check entry-date schedule and Chapter 99 before using a rate for a shipment.

    Accessed 2026-11-02
  25. Dallas Fed, USMCA trade outlook and model assumptions

    Supplier switching, trade diversion and conditional tariff-revenue redistribution. January 2026 policy scenario, not a measured full-year welfare result.

    Accessed 2026-11-02
  26. CBP, Trade and National Security Actions and Low-Value Shipments, proposed rule

    2025 proposed-rule analysis, pages 25-26: consumer surplus and tariff-revenue transfer. Used for methodology, not current legal status or 2026 outcomes.

    Accessed 2026-11-02

Questions and answers

Do foreign countries pay U.S. tariffs?

Importers pay duties at entry. Economic incidence can be shared through prices and margins. The research reviewed here finds substantial U.S.-side burden, but this does not identify a single universal household share.

Does a 25% tariff make a product 25% more expensive?

Not necessarily. The tariff normally applies to customs value, which may be much lower than retail price. Supplier responses, margins and other costs also matter.

Can falling prices mean tariffs had no effect?

No. A price may have fallen further without the tariff. Establishing that alternative requires evidence beyond the observed price change.

Is there a verified total for what households paid in 2026?

This November 2 review does not establish one. The year is incomplete and published estimates differ in policies, periods, baselines and outcomes.

For journalists: copy briefing & citation

Use the dated figures with their scope and source. Charts above include vector and CSV downloads. A scenario or survey response should not be described as a measured outcome for every household.

Asim Ahmad. “Tariffs and Household Costs in 2026: What the Evidence Shows.” FinanceFirst Research, version 1.2, October 13, 2026. https://financefirst.co/reports/tariffs-household-costs-2026