
FinanceFirst Research
Financial Fraud in America 2026: State Loss Rates, Income, Age and Scam Type
An objective analysis of full-year 2025 FBI IC3 reports with transparent source roles, state comparisons, statistical validation and consumer reporting guidance
Data through FBI IC3 reports through December 31, 2025; Census income through 2024; population through July 1, 2025Latest official release: April 16, 2026Version 1.2
Executive summary
What this report finds
FBI IC3 recorded 1,008,597 complaint reports and $20.877 billion in reported loss during 2025. This report calculates population-adjusted state rates from the FBI and Census inputs, documents the different roles of FTC Consumer Sentinel, CFPB complaint and FinCEN SAR data, and provides a state dashboard and direct reporting routes. Complaint systems are not combined, state patterns are not causal, and the rankings do not measure total fraud prevalence.
Read before comparing states
Methodology & Data Sources
What is synthesized: the published state rankings are calculated from raw aggregate values in the FBI's 2025 Internet Crime Complaint Center Annual Report and U.S. Census population estimates. The income analysis adds the Census Bureau's 2024 ACS state median-household-income table. FTC Consumer Sentinel, the CFPB Consumer Complaint Database and FinCEN Suspicious Activity Report statistics are authoritative comparison sources, but they are not merged into the IC3 rankings because their submitters, definitions, coverage and update schedules differ.
Exact analysis timeframes
- FBI IC3: complaint reports and reported adjusted loss for January 1 through December 31, 2025.
- Population denominator: Census Vintage 2025 resident-population estimates for July 1, 2025.
- Household income: 2024 ACS median household income in 2024 inflation-adjusted dollars.
- FTC Consumer Sentinel: the 2024 Data Book and quarterly dashboard are cited for separate consumer-report context and state exploration, not for the IC3 calculations.
- CFPB complaints: the public database generally updates daily and is cited for financial-product complaint context. No CFPB extract is included in the ranking model.
- FinCEN: SAR filings-by-industry data cover January 1, 2014 through December 31, 2024 and include state and territory rankings. They describe financial-institution filings, not consumer complaint prevalence.
Source roles and combination rules
| Source | Role in this report | Included in state rankings? | Primary limitation |
|---|---|---|---|
| FBI IC3 2025 Annual Report | Complaint, loss, crime-type, age and cryptocurrency-descriptor inputs | Yes | Reports are not unique victims, verified incidents or total prevalence |
| U.S. Census Bureau | Population denominator and income comparison | Yes | Population estimates can be revised; ACS income is a sample estimate and not wealth |
| FTC Consumer Sentinel Network | Separate fraud and identity-theft comparison context | No | Unverified reports from a broader contributor network; definitions differ from IC3 |
| CFPB Consumer Complaint Database | Financial-product complaint context and company-response research | No | Not a statistical sample and not representative of every consumer experience |
| FinCEN SAR statistics | Financial-institution suspicious-activity and state-ranking context | No | SARs are institution filings and cannot be treated as consumer incidents or confirmed crimes |
Calculation rules: complaint reports per 100,000 = IC3 complaint reports divided by population, multiplied by 100,000. Reported loss per 100,000 uses the same denominator. Average reported loss per complaint = reported loss divided by complaint reports. Credit Card/Check remains the FBI's combined category. Cryptocurrency is an overlapping descriptor and is never added to Investment or overall loss.
Interpretation: this is a descriptive, ecological state analysis. It does not estimate an individual's fraud probability, identify offender location or establish that income, age, digital-banking adoption, urbanization or another state trait caused a ranking.
Consumer action guide
How to Report Financial Fraud in Your State
If money is moving now, contact the bank, card issuer, credit union, payment app or exchange first. Ask for the fraud department and whether the transaction can be stopped, recalled or frozen. Preserve confirmation numbers and the name of each person you contact.
Identity theft
Use IdentityTheft.gov to create an FTC Identity Theft Report and a personal recovery plan. Save or print the report and follow the account, credit-report and document-replacement steps that apply to your situation.
Internet-enabled fraud or a fraudulent transfer
File at the FBI's IC3 complaint portal. Include verified transaction dates, amounts, account details, routing information, wallet addresses and communications. Keep sensitive identifiers out of the narrative unless the official form specifically requests them.
General scams and consumer fraud
Report through ReportFraud.ftc.gov. The report enters the FTC's Consumer Sentinel Network and the site provides next-step guidance. The FTC does not resolve individual disputes.
Your state Attorney General
Use the official USA.gov state Attorney General directory to find the consumer-protection or complaint portal for your state or territory. State offices have different jurisdiction and documentation rules.
Problem with a financial company
After contacting the company, use the CFPB complaint portal for covered products such as bank accounts, credit cards, credit reporting, debt collection, money transfers, mortgages and loans. The CFPB generally forwards eligible complaints to companies for response.
Threats, coercion or immediate danger
Contact local law enforcement or emergency services. Online federal reports do not replace an immediate safety response or a police report that an institution, insurer or identity-theft recovery process may require.
Information to gather before filing
- A concise timeline with dates, amounts and how contact began.
- Transaction IDs, account or wallet details, payment method and destination.
- Messages, emails, phone numbers, usernames, websites and screenshots.
- Names of companies already contacted, case numbers and written responses.
At a glance
Key findings
- $20.877B↗
Reported IC3 loss in 2025
FBI; 26% higher than 2024
- 1,008,597↔
IC3 complaint reports in 2025
Reports, not unique victims
- +45.8%↗
Credit Card/Check complaint change
2024 to 2025; combined FBI category
- +52.3%↗
Investment complaint change
2024 to 2025
- rho = 0.745↔
Income and state loss-rate rank association
50 states; bootstrap interval 0.577 to 0.849
- 4 groups↔
Frequency and severity newsroom matrix
50-state medians; descriptive only
- $7.748B↗
Reported loss for the 60+ group
FBI national age chart
Definitions readers asked us to clarify
Questions readers asked
Are IC3 complaint reports the same as unique victims?
No. A complaint is a report submitted to IC3. The public data do not establish that every record is a unique victim or a verified incident.
Why is Washington, D.C. not in the state ranking?
Washington, D.C. is a federal district rather than a state. It remains in the downloadable 51-jurisdiction table but is excluded from 50-state ranks, correlations and income quintiles.
Was this report reviewed by a fraud or payments specialist?
No such approval is claimed. Version 1.2 passed automated source and calculation checks but was published without claimed approval from a Certified Fraud Examiner, payments-risk professional, attorney, cybersecurity specialist or other external reviewer.
Ungated research data
Download the Financial Fraud in America 2026 data package
Includes 50 states plus Washington, D.C., state rates and ranks, national and age tables, exposure groups, statistical validation, source audits, reporter workbooks, charts, citations and checksums.
Table of contents
- Methodology & Data Sources
- How to Report Financial Fraud in Your State
- What This Report Measures, and What It Does Not
- Credit Card/Check, Investment and Cryptocurrency Reports All Increased
- Raw State Totals and Population-Adjusted Rates Answer Different Questions
- A Four-Way Matrix Separates Reporting Frequency From Loss Severity
- The Income Relationship Is Positive Across Multiple Checks, but It Is Not Causal
- Reported Loss Was Highest for the 60-and-Older Group
- Why Did Reported Losses Rise?
- What Financial Institutions and Law Enforcement Are Doing
- Immediate Actions Before You File Reports
- Journalist Desk: Quotable Findings, Local Angles and Citation Guidance
- Download the Data, Methods, Citation Files and Journalist Media Kit
- Sources
What This Report Measures, and What It Does Not
Short answer: this report measures activity reported to the FBI Internet Crime Complaint Center, not every fraud incident in the United States. IC3 recorded 1,008,597 complaint reports and $20.877 billion in reported loss during 2025. The FBI reported that loss was 26% higher than in 2024 and listed an average reported loss of $20,699.
A complaint report is not necessarily a unique person, a verified crime or the location of an offender. Some incidents are never reported, some records omit age or complete loss information, and reporting behavior can vary by place and circumstance. For that reason, this report uses phrases such as reported complaints, reported loss and complaints per 100,000 residents.
Credit Card/Check, Investment and Cryptocurrency Reports All Increased
The FBI's three-year tables show that Credit Card/Check Fraud complaint reports increased from 12,876 in 2024 to 18,774 in 2025. FinanceFirst calculates a 45.8% increase. Reported loss increased from $199.9 million to $282.7 million, up 41.4%.
The FBI category is broader than credit-card-only fraud. The public state tables do not provide a credit-card-only ranking.
Investment complaint reports increased from 47,919 in 2024 to 72,984 in 2025, up 52.3%. Reported Investment loss increased from $6.571 billion to $8.649 billion, up 31.6%. Separately, the FBI recorded 181,565 complaints with a cryptocurrency nexus and $11.367 billion in associated reported loss. Cryptocurrency is an overlapping descriptor, so it is never added to Investment or another crime type.
Reported complaint and loss change, 2024 to 2025
Percent change calculated from the FBI IC3 three-year tables. These are changes in reported activity, not population-adjusted national fraud rates.
View chart data
| Period or category | Complaint reports | Reported loss |
|---|---|---|
| Credit Card/Check | 45.8% | 41.4% |
| Investment | 52.3% | 31.6% |
Raw State Totals and Population-Adjusted Rates Answer Different Questions
California led the 50 states in total 2025 IC3 complaint reports and reported loss. Raw totals describe the volume reported from a jurisdiction; population-adjusted rates describe reported activity relative to resident count. Neither measure is a probability that a resident will experience fraud.
Among the 50 states, Alaska had the highest complaint-report rate at 434.3 per 100,000 residents, followed by Nevada at 407.2 and Arizona at 378.7. California had the highest reported loss per 100,000 residents at $9.34 million, followed by Nevada at $9.21 million and Arizona at $8.27 million.
Washington, D.C. recorded 448.8 complaint reports and $14.04 million in reported loss per 100,000 residents. It is shown separately because it is a federal district and is not included in the 50-state ranks, medians, quintiles or correlations.
Why this matters: measured local patterns, not assumed causes
The table below adds context using measures that are actually present in the verified dataset. It does not attribute a state's position to age, digital-banking adoption, phishing groups or any other factor that was not tested.
| State | Complaint-rate rank | Loss-rate rank | Average loss rank | What the pattern supports asking |
|---|---|---|---|---|
| California | 12 | 1 | 3 | Why is reported loss intensity high even though its complaint rate is outside the top 10? |
| Nevada | 2 | 2 | 7 | Which reported case types or transfer channels are associated with both high frequency and high loss? |
| Arizona | 3 | 3 | 11 | Do local agencies see the same high-frequency, high-loss pattern in independently collected records? |
| Alaska | 1 | 18 | 46 | Why is reporting frequency high while average reported loss per complaint is comparatively low? |
| New Jersey | 41 | 5 | 2 | Are fewer but larger reported cases driving the state's loss-rate rank? |
Use the interactive dashboard below to search all 50 states and rerank them by complaint reports per 100,000, reported loss per 100,000 or average reported loss per complaint. Download the full CSV for raw totals, rates, ranks and classification fields.
Highest complaint-report rates among the 50 states
Complaint reports per 100,000 residents. Washington, D.C. is not included in the state ranking and is shown separately in the text.
View chart data
| Period or category | Complaint reports per 100,000 |
|---|---|
| Alaska | 434.3 |
| Nevada | 407.2 |
| Arizona | 378.7 |
| Massachusetts | 320.6 |
| Washington | 320.2 |
| Colorado | 313.1 |
| Maryland | 310.1 |
| New Hampshire | 309 |
| Texas | 308.8 |
| Florida | 306.2 |
Highest reported-loss rates among the 50 states
Millions of dollars in reported loss per 100,000 residents. Washington, D.C. is not included in the state ranking.
View chart data
| Period or category | Reported loss per 100,000 |
|---|---|
| California | 9.34M |
| Nevada | 9.21M |
| Arizona | 8.27M |
| Hawaii | 7.43M |
| New Jersey | 6.92M |
| Florida | 6.8M |
| Rhode Island | 6.59M |
| Maryland | 6.23M |
| New York | 6.13M |
| Connecticut | 5.95M |
Interactive 50-state data dashboard
Compare frequency, loss rate and loss severity
Select a measure to rerank all 50 states. Washington, D.C. is excluded from state ranks and remains available in the downloadable 51-jurisdiction dataset.
Leading state
California
$9.34M
50-state median
$4.58M
Descriptive midpoint, not a risk threshold
States shown
50
Sorted by loss per 100,000
| Rank | State | Loss per 100,000 | Reports | Reported loss | Frequency / severity group |
|---|---|---|---|---|---|
| #1 | California CA | $9.34M | 116,414 | $3.67B | Higher frequency, higher severity |
| #2 | Nevada NV | $9.21M | 13,366 | $302.24M | Higher frequency, higher severity |
| #3 | Arizona AZ | $8.27M | 28,868 | $630.7M | Higher frequency, higher severity |
| #4 | Hawaii HI | $7.43M | 3,328 | $106.45M | Lower frequency, higher severity |
| #5 | New Jersey NJ | $6.92M | 20,648 | $660.41M | Lower frequency, higher severity |
| #6 | Florida FL | $6.80M | 71,843 | $1.6B | Higher frequency, higher severity |
| #7 | Rhode Island RI | $6.46M | 2,700 | $71.96M | Lower frequency, higher severity |
| #8 | Maryland MD | $6.23M | 19,430 | $390.24M | Higher frequency, higher severity |
| #9 | New York NY | $6.13M | 45,255 | $1.23B | Lower frequency, higher severity |
| #10 | Connecticut CT | $5.95M | 9,714 | $219.5M | Higher frequency, higher severity |
| #11 | Colorado CO | $5.91M | 18,847 | $355.05M | Higher frequency, higher severity |
| #12 | Delaware DE | $5.85M | 3,089 | $62.01M | Higher frequency, higher severity |
| #13 | Texas TX | $5.76M | 97,912 | $1.83B | Higher frequency, higher severity |
| #14 | Massachusetts MA | $5.74M | 22,936 | $410.92M | Higher frequency, lower severity |
| #15 | Washington WA | $5.73M | 25,619 | $458.17M | Higher frequency, lower severity |
| #16 | Utah UT | $5.52M | 9,903 | $195.42M | Higher frequency, higher severity |
| #17 | South Dakota SD | $5.50M | 2,514 | $51.45M | Higher frequency, higher severity |
| #18 | Alaska AK | $5.42M | 3,202 | $39.97M | Higher frequency, lower severity |
| #19 | Virginia VA | $5.36M | 25,314 | $476.12M | Higher frequency, higher severity |
| #20 | West Virginia WV | $5.25M | 4,209 | $92.65M | Lower frequency, higher severity |
| #21 | Kansas KS | $4.95M | 7,927 | $147.34M | Higher frequency, higher severity |
| #22 | South Carolina SC | $4.74M | 14,699 | $264.08M | Higher frequency, lower severity |
| #23 | North Dakota ND | $4.74M | 1,418 | $37.87M | Lower frequency, higher severity |
| #24 | Georgia GA | $4.73M | 25,936 | $534.58M | Lower frequency, higher severity |
| #25 | Montana MT | $4.65M | 2,618 | $53.19M | Lower frequency, higher severity |
| #26 | Oregon OR | $4.52M | 12,477 | $193.2M | Higher frequency, lower severity |
| #27 | Wyoming WY | $4.39M | 1,552 | $25.83M | Higher frequency, lower severity |
| #28 | Idaho ID | $4.37M | 4,479 | $88.73M | Lower frequency, higher severity |
| #29 | Minnesota MN | $4.27M | 13,595 | $248.89M | Lower frequency, higher severity |
| #30 | Illinois IL | $4.21M | 32,977 | $535.26M | Higher frequency, lower severity |
| #31 | New Hampshire NH | $4.19M | 4,374 | $59.28M | Higher frequency, lower severity |
| #32 | Vermont VT | $4.12M | 1,580 | $26.57M | Lower frequency, lower severity |
| #33 | Pennsylvania PA | $4.12M | 31,154 | $537.79M | Lower frequency, lower severity |
| #34 | New Mexico NM | $4.03M | 5,688 | $85.57M | Higher frequency, lower severity |
| #35 | Maine ME | $4.00M | 2,888 | $56.54M | Lower frequency, higher severity |
| #36 | North Carolina NC | $3.85M | 25,940 | $431.56M | Lower frequency, lower severity |
| #37 | Michigan MI | $3.76M | 22,191 | $381.07M | Lower frequency, lower severity |
| #38 | Missouri MO | $3.73M | 14,087 | $233.93M | Lower frequency, lower severity |
| #39 | Tennessee TN | $3.68M | 16,261 | $269.21M | Lower frequency, lower severity |
| #40 | Nebraska NE | $3.56M | 3,724 | $71.84M | Lower frequency, higher severity |
| #41 | Ohio OH | $3.54M | 27,626 | $421.29M | Lower frequency, lower severity |
| #42 | Indiana IN | $3.34M | 20,777 | $233.02M | Higher frequency, lower severity |
| #43 | Arkansas AR | $3.29M | 6,161 | $102.54M | Lower frequency, lower severity |
| #44 | Wisconsin WI | $3.25M | 16,680 | $194.23M | Higher frequency, lower severity |
| #45 | Alabama AL | $3.22M | 9,936 | $167.21M | Lower frequency, lower severity |
| #46 | Oklahoma OK | $3.20M | 11,964 | $131.92M | Higher frequency, lower severity |
| #47 | Iowa IA | $2.95M | 5,436 | $95.52M | Lower frequency, lower severity |
| #48 | Mississippi MS | $2.62M | 5,084 | $77.36M | Lower frequency, lower severity |
| #49 | Kentucky KY | $2.60M | 9,414 | $119.69M | Lower frequency, lower severity |
| #50 | Louisiana LA | $2.28M | 8,623 | $105.44M | Lower frequency, lower severity |
These rankings describe reports submitted to IC3 by complainant location. They do not measure total fraud prevalence, offender location or an individual resident's probability of loss.
Download all fieldsA Four-Way Matrix Separates Reporting Frequency From Loss Severity
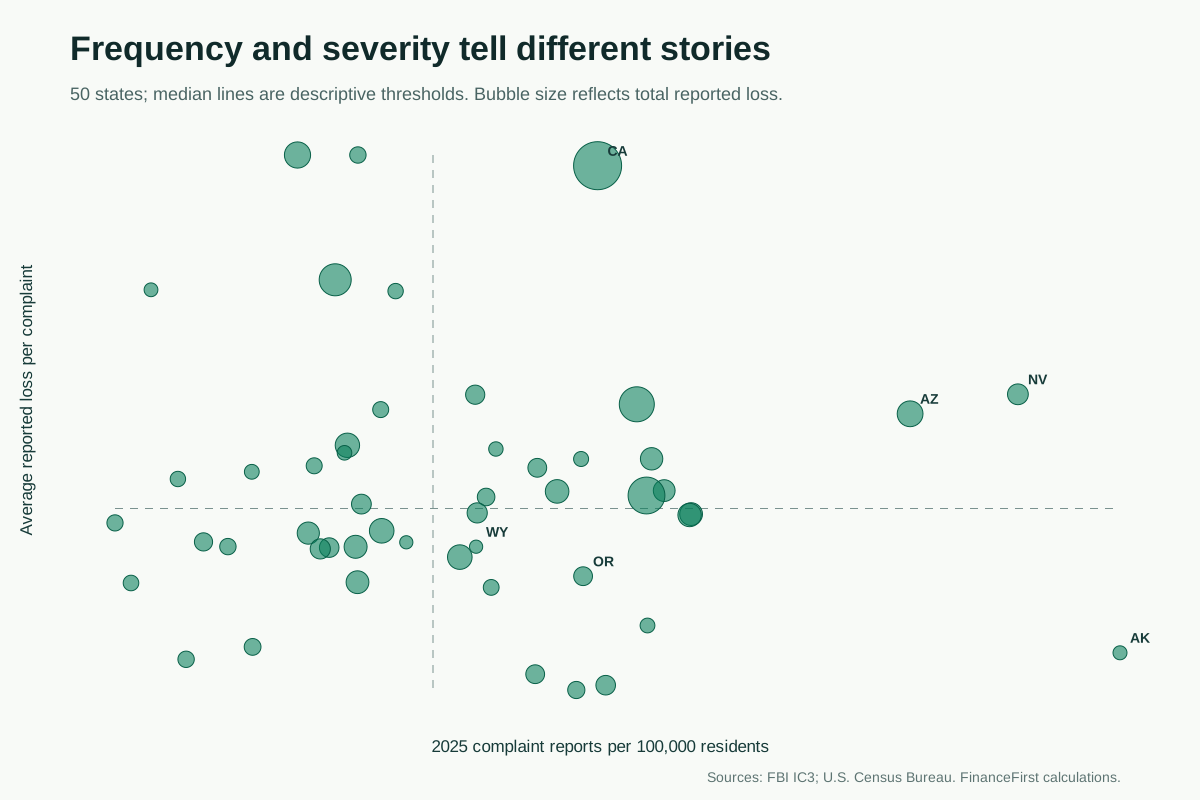
A raw total, complaint rate and average loss answer different questions. To give local reporters a clearer starting point, FinanceFirst divides the 50 states at the state medians: 252.2 complaint reports per 100,000 and $18,137 average reported loss per complaint. Washington, D.C. is excluded.
| Group | States | Useful local question |
|---|---|---|
| Higher frequency, higher severity | AZ, CA, CO, CT, DE, FL, KS, MD, NV, SD, TX, UT, VA | Are case mix, transaction size or reporting patterns driving both measures? |
| Higher frequency, lower severity | AK, IL, IN, MA, NH, NM, OK, OR, SC, WA, WI, WY | Do prevention, case mix or reporting access help explain the lower average? |
| Lower frequency, higher severity | GA, HI, ID, ME, MN, MT, ND, NE, NJ, NY, RI, WV | Are fewer but larger reported cases shaping the state pattern? |
| Lower frequency, lower severity | AL, AR, IA, KY, LA, MI, MO, MS, NC, OH, PA, TN, VT | How much do underreporting, case mix and local prevention resources matter? |
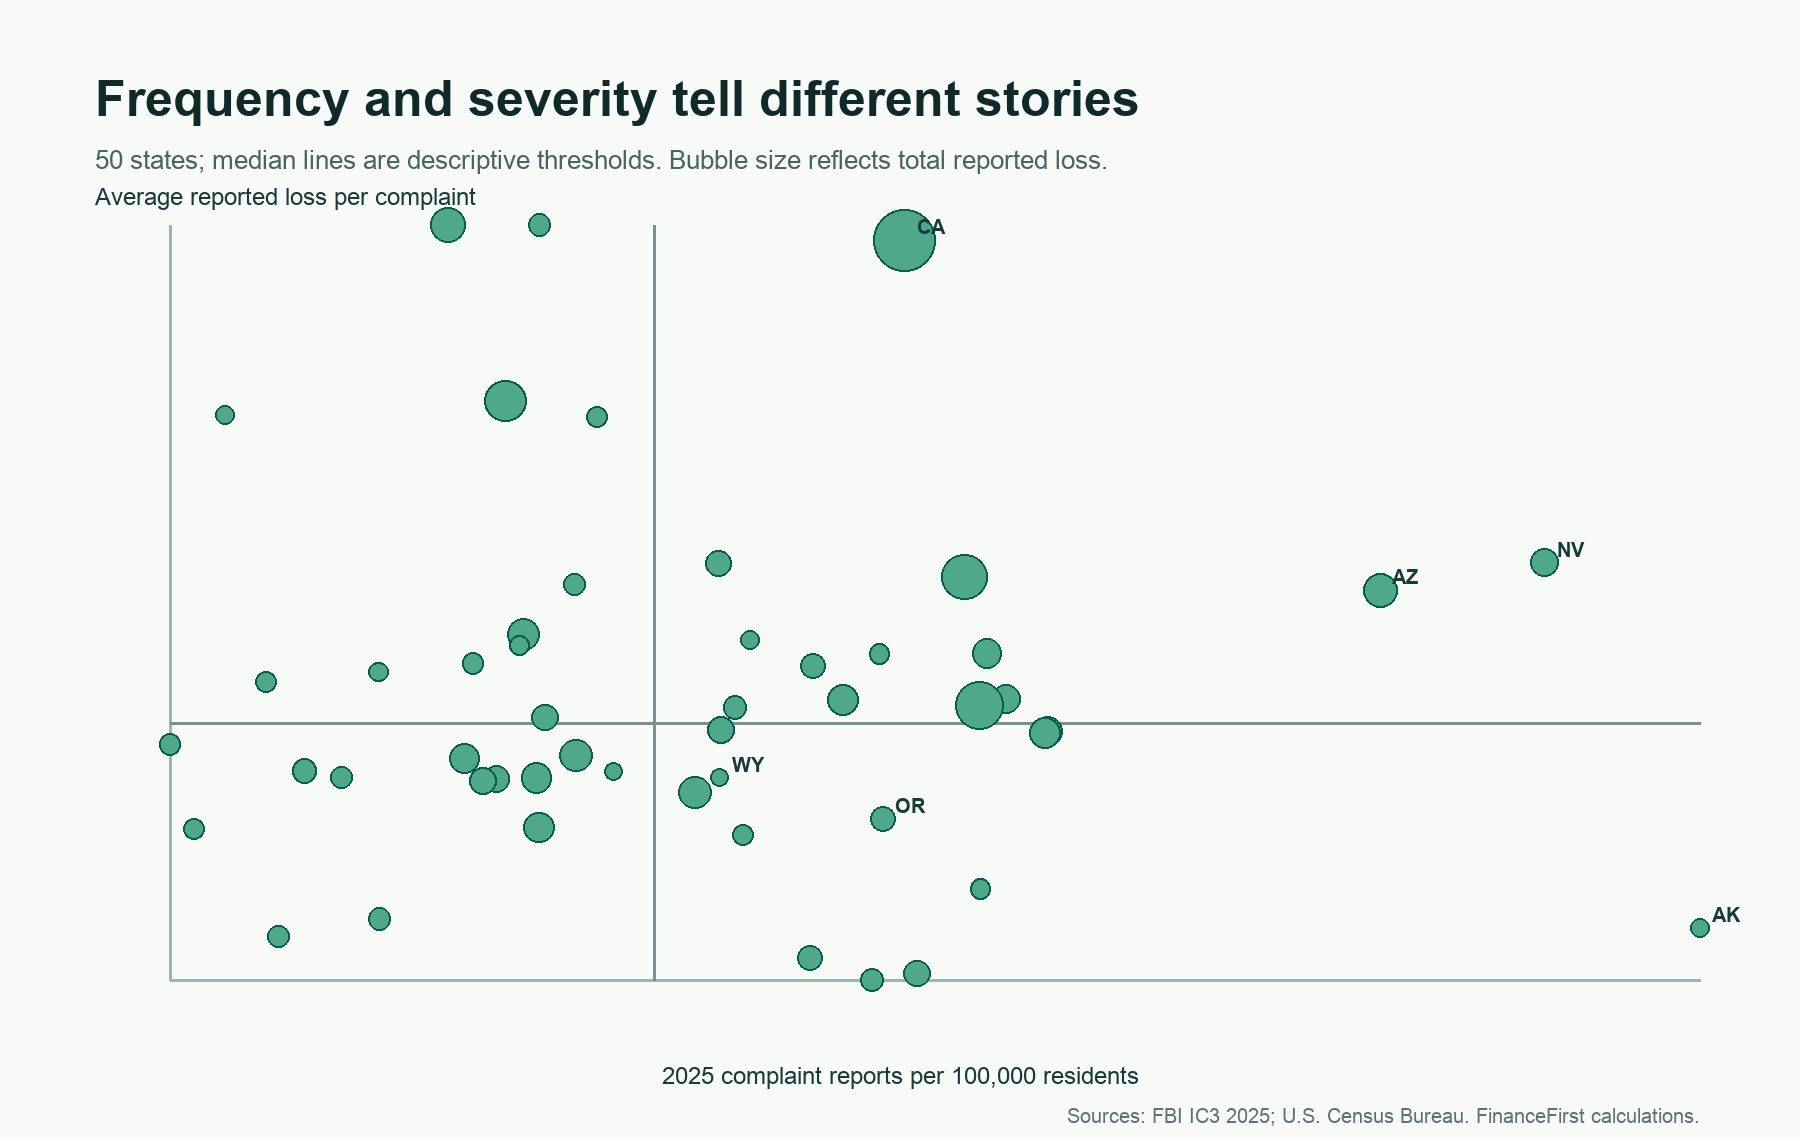
Download the editable SVG, high-resolution PNG or chart data.
The Income Relationship Is Positive Across Multiple Checks, but It Is Not Causal
Across the 50 states, the relationship between 2024 median household income and 2025 reported loss per 100,000 residents was Pearson r = 0.634 and Spearman rho = 0.745. The deterministic 10,000-resample Spearman bootstrap interval was 0.577 to 0.849. Recalculating Pearson r after leaving out one state at a time produced a range of 0.609 to 0.688.
The same validation package reports Pearson and Spearman associations for complaint rate, average reported loss per complaint and cryptocurrency-descriptor loss rate. The full values, bootstrap intervals and leave-one-out ranges are in the analysis workbook, journalist workbook, JSON dataset and validation report.
Income quintiles show a similar descriptive pattern. Median reported loss per 100,000 residents was $3.26 million in the lowest-income group of 10 states and $5.93 million in the highest-income group. Median complaint-report rates were 214.5 and 302.4 per 100,000, respectively.
This does not show that higher income causes fraud. Median household income is not household wealth. The analysis is state-level, not person-level, and does not control for reporting awareness, transaction volume, urbanization, industry mix, population age, digital activity or other factors. It cannot identify which households reported losses or why.
Reported Loss Was Highest for the 60-and-Older Group
The FBI reported 201,266 complaint reports and $7.748 billion in reported loss for people age 60 and older, the highest loss among the displayed age groups. The agency reported an average loss of $38,500 for that group and said 12,444 complainants reported losses greater than $100,000.
Age was not available for every complaint. The headline age-loss values are rounded in the FBI's accessibility description, so the displayed groups do not sum exactly to the national total. The age chart is national and should not be read as a state-level age analysis.
For complaints with a cryptocurrency nexus, the FBI reported $4.432 billion in losses for the 60-and-older group. Cryptocurrency descriptors can overlap crime types and are not added to Investment totals.
Reported loss by age group
Billions of dollars in 2025 reported loss. Values are rounded in the FBI accessibility text and exclude complaints without reported age.
View chart data
| Period or category | Reported loss |
|---|---|
| Under 20 | 0.07B |
| 20-29 | 0.56B |
| 30-39 | 1.7B |
| 40-49 | 2.96B |
| 50-59 | 3.7B |
| 60+ | 7.75B |
Why Did Reported Losses Rise?
The public tables establish that reported losses increased. They do not isolate one national cause. Investment was the largest 2025 IC3 crime type by reported loss at $8.649 billion, and cryptocurrency investment fraud was described by the FBI as the highest source of financial loss to Americans at about $7.2 billion. The FBI also described long-running manipulation, fake trading platforms, social-media and messaging outreach, impersonation and recovery scams.
The FBI reported 22,364 complaints with an artificial-intelligence nexus and $893.3 million in associated loss. Investment complaints with a reported AI nexus accounted for $632.0 million, but the FBI cautioned that many complainants may not realize AI was involved. These figures show a reported AI connection, not proof that AI caused the overall increase.
Any stronger explanation requires transaction-level research, controlled analysis or verified practitioner evidence. The report therefore avoids attributing the national increase to one technology, age group, income level or state characteristic.
What Financial Institutions and Law Enforcement Are Doing
The clearest public operational evidence in the 2025 IC3 report involves rapid coordination after a fraudulent transfer. The FBI's Recovery Asset Team uses the Financial Fraud Kill Chain to communicate with financial institutions and law-enforcement partners and request freezes. For 2025, the FBI reported 3,900 incidents, $1.164 billion in attempted theft and $679.0 million frozen, described as a 58% success rate. These are FBI-reported program outputs, not the recovery rate for every fraud complaint.
Operation Level Up uses IC3 data to identify and notify people believed to be caught in cryptocurrency investment scams. The FBI reported 3,780 people notified in 2025, said 78% were unaware they were being scammed and estimated $225.9 million in savings. Again, these figures describe the program's selected cases, not the entire market.
The FBI advises people who discover a fraudulent transfer to contact their financial institution immediately, request a recall and file an IC3 complaint with complete transaction details. Speed matters because funds can move through multiple accounts. Policies and outcomes vary by institution and case.
Immediate Actions Before You File Reports
- Contact the financial institution or payment platform immediately using a verified number, website or app. Ask whether a transfer can be stopped, recalled or frozen. Reporting to a government portal does not replace this step.
- Secure affected accounts. Change compromised credentials, enable stronger authentication where available and ask the institution whether cards or account numbers should be replaced.
- Preserve evidence. Save dates, amounts, transaction IDs, wallet addresses, account details, phone numbers, messages, emails and screenshots. Keep original files where possible.
- Write a short chronology. Record what happened, when you discovered it, who you contacted and the response. Use the same verified facts across reports.
Then use the reporting guide near the top of this page to choose the federal, state and product-specific route that matches the incident.
Journalist Desk: Quotable Findings, Local Angles and Citation Guidance
Citation-ready national finding: FBI IC3 recorded 1,008,597 complaint reports and $20.877 billion in reported loss during 2025. Complaint reports are not unique victims, verified incidents or total fraud prevalence.
Citation-ready state finding: California ranked first among the 50 states in reported loss per 100,000 residents, while Alaska ranked first in complaint reports per 100,000. Washington, D.C. was higher than every state on both rates but is reported separately as a federal district.
Citation-ready trend finding: from 2024 to 2025, Credit Card/Check complaint reports rose 45.8% and Investment complaint reports rose 52.3%. Credit Card/Check is a combined FBI category, not a credit-card-only measure.
Local reporting angles
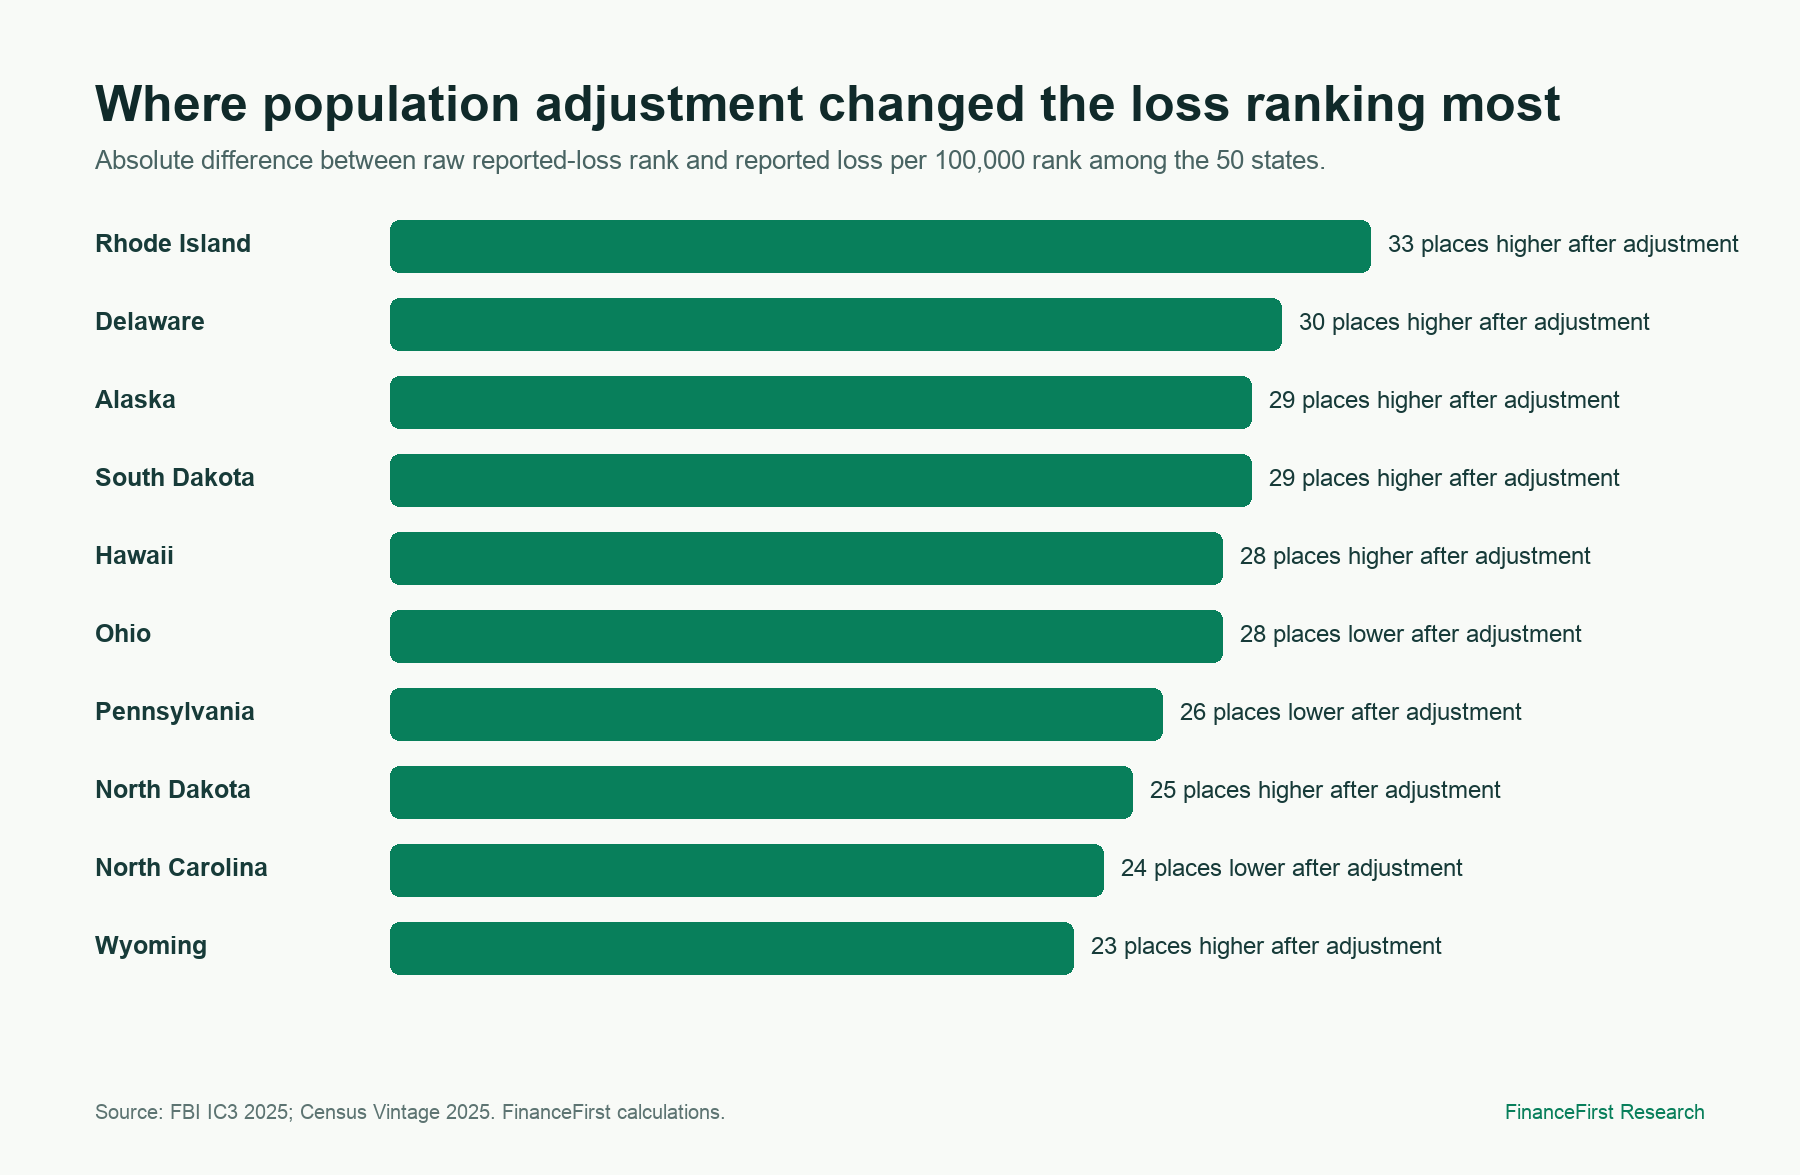
- Compare each state's raw reported-loss rank with its population-adjusted rank. Rhode Island moved from 40th in raw reported loss to 7th in reported loss per 100,000.
- Use the four-way matrix to ask state agencies, banks, credit unions and consumer groups about local reporting access, case mix, transfer speed and prevention resources.
- Pair the state table with local interviews. The dataset cannot explain a state's position or establish whether an individual case is representative.
- Use the national age table carefully: it is not a state-by-age table, and some complaints omitted age.
Suggested citation: FinanceFirst Research. Financial Fraud in America 2026: State Risk, Category Trends, and Income Patterns. Version 1.2, August 27, 2026. https://financefirst.co/reports/financial-fraud-by-state-2026.
For due diligence, download the claim-to-source audit, validation report, state newsroom table and complete media kit.
Download the Data, Methods, Citation Files and Journalist Media Kit
The complete public package is ungated and designed for checking, local reporting and citation. It includes:
Reporter-ready files
- Journalist tables workbook with quick facts, a 50-state table, national tables, statistical validation, quality checks, sources and a suggested citation.
- Two-page journalist fact sheet and one-page methodology brief.
- Journalist media kit ZIP and SVG, PNG and chart-data pack.
- State rankings and newsroom angles, publication-safe quotable findings and journalist briefing notes.
Data and reproducibility
- 51-jurisdiction CSV, structured JSON and 12-sheet analysis workbook.
- National trend and age tables, source ledger and data dictionary.
- Claim-to-source audit, machine-readable validation report and SHA-256 checksum manifest.
- Full methodology PDF, machine-readable methods, version and corrections log and data and sources ZIP.
- Citation formats: plain text, Citation File Format and BibTeX.
Review status: Version 1.2 passed the published automated checks but does not claim approval from a Certified Fraud Examiner, payments-risk professional, attorney, cybersecurity specialist or other external reviewer. Source reconciliation and calculation checks are not a substitute for human expert review.
Questions and corrections can be submitted through FinanceFirst contact. The public corrections policy explains how material updates are handled.
Technical methods and validation
Calculation inputs: full-year 2025 IC3 complaint reports and adjusted losses; Census Vintage 2025 population estimates for July 1, 2025; and 2024 ACS median household income. FTC Consumer Sentinel, CFPB complaints and FinCEN SAR statistics are comparison or consumer-action sources only and are not merged into the rankings.
Timeframes: IC3 covers January 1 through December 31, 2025. Population is estimated for July 1, 2025. Income reflects calendar year 2024. The report does not use a Q1 2025 through Q1 2026 analysis window or 2026 population estimates.
Population formulas: complaint reports per 100,000 = complaint reports / population x 100,000. Reported loss per 100,000 = adjusted loss / population x 100,000. Average reported loss per complaint = adjusted loss / complaint reports. The average is not a median.
Income analysis: Pearson r and average-rank Spearman rho use the 50 states only. The Spearman interval uses 10,000 deterministic paired bootstrap resamples. Leave-one-out ranges recalculate Pearson r after omitting each state. Washington, D.C. is excluded. Income is not wealth.
Classification rules: Credit Card/Check retains the FBI's combined label. Cryptocurrency is an overlapping descriptor and is not added to Investment or another crime type. FTC, CFPB, FinCEN and FBI values are never added. Geography is complainant location, not offender location.
Official-source warning: the FBI's published Oregon cryptocurrency-descriptor loss exceeds its published Oregon overall reported loss. Both official values are retained for reproducibility, and no cryptocurrency share of state loss is calculated.
Review status: Version 1.2 passed the published automated source, calculation, structure and artifact-integrity checks. No approval from a Certified Fraud Examiner, payments-risk professional, attorney, cybersecurity specialist or other external reviewer is claimed.
Sources and data references
Sources are listed for transparency. Data periods may differ, so each chart and claim should be read with its cited date and methodology.
- FBI Internet Crime Complaint Center - 2025 IC3 Annual Report
Primary source for national, state, age, crime-type, cryptocurrency, AI-nexus, Financial Fraud Kill Chain and Operation Level Up figures. See pages 6-11, 16-20, 25-32, 39-45, 52-57 and Appendix C.
Accessed August 27, 2026
- U.S. Census Bureau - Vintage 2025 State Population Estimates
Primary resident-population denominator using POPESTIMATE2025 for the 50 states and Washington, D.C.
Accessed August 27, 2026
- U.S. Census Bureau - Household Income in States and Metropolitan Areas: 2024
Primary source for 2024 ACS median household income in Appendix Table 1. Values are sample estimates in 2024 inflation-adjusted dollars; income is not wealth.
Accessed August 27, 2026
- Federal Trade Commission - FTC Testimony at the Joint Economic Committee Hearing on the Rising Scam Economy
Primary source for separate FTC 2025 national context. FTC and IC3 totals use different reporting systems and are not combined.
Accessed August 27, 2026
- SEC Investor.gov - How to Avoid Fraud
Official investment-fraud warning signs, registration checks and consumer guidance.
Accessed August 27, 2026
- Federal Trade Commission - ReportFraud.ftc.gov
Official consumer fraud reporting portal and response guidance. It is not a calculation source for the IC3 state analysis.
Accessed August 27, 2026
- Consumer Financial Protection Bureau - Unauthorized Credit Card Charges
Official consumer guidance for contacting the issuer and reporting unauthorized credit-card charges.
Accessed August 27, 2026
- Federal Trade Commission - Consumer Sentinel Network Data Book 2024
Authoritative separate context for unverified consumer reports about fraud, identity theft and other consumer problems. Sentinel and IC3 figures are not combined.
Accessed August 27, 2026
- Consumer Financial Protection Bureau - Consumer Complaint Database
Public financial-product complaint data and company-response information. The database is not a statistical sample and is not an input to the IC3 state rankings.
Accessed August 27, 2026
- Financial Crimes Enforcement Network - SAR Filings by Industry
State and territory rankings and suspicious-activity categories compiled from financial-institution SAR filings for January 1, 2014 through December 31, 2024. Context only; SARs are not consumer complaints or confirmed crimes.
Accessed August 27, 2026
- Federal Trade Commission - IdentityTheft.gov
Official portal for an FTC Identity Theft Report and personal recovery plan.
Accessed August 27, 2026
- FBI Internet Crime Complaint Center - Complaint Form
Official complaint portal for internet-enabled crime. Reports can be referred to appropriate law-enforcement partners.
Accessed August 27, 2026
- USAGov - State Attorneys General Directory
Official directory for finding the Attorney General and consumer-protection resources in each state or territory.
Accessed August 27, 2026
Frequently asked questions about this report
How much financial fraud loss was reported to the FBI in 2025?
The FBI IC3 reported $20.877 billion in adjusted loss across 1,008,597 complaint reports in 2025. This is reported activity, not a complete estimate of all U.S. fraud loss or unique victims.
Which state had the highest reported fraud loss rate in 2025?
California had the highest reported IC3 loss per 100,000 residents among the 50 states at about $9.34 million, using Census Vintage 2025 population estimates. Washington, D.C. was higher at about $14.04 million but is a federal district and is shown separately.
Which state had the highest IC3 complaint-report rate?
Alaska had the highest complaint-report rate among the 50 states at about 434.3 per 100,000 residents. Washington, D.C. was higher at about 448.8 but is not a state.
Do higher-income states have more fraud?
The state-level analysis found Pearson r = 0.634 and Spearman rho = 0.745 between 2024 median household income and 2025 reported loss per 100,000 across the 50 states. The Spearman bootstrap interval was 0.577 to 0.849. These are descriptive associations, not evidence that income causes fraud. Income is not wealth.
How much did Credit Card/Check Fraud reports increase?
FBI IC3 Credit Card/Check Fraud complaint reports increased 45.8% from 2024 to 2025, while reported loss increased 41.4%. This is a combined FBI category and is not credit-card-only.
Can cryptocurrency and investment fraud losses be added together?
No. Cryptocurrency is an overlapping IC3 descriptor. The FBI also publishes an Oregon cryptocurrency-descriptor loss that exceeds its Oregon overall loss, so the official descriptor values cannot be used as mutually exclusive shares. FinanceFirst keeps these measures separate and discloses the inconsistency.
Which age group reported the highest IC3 loss?
People age 60 and older had $7.748 billion in reported loss, the highest among the age groups displayed by the FBI. Some complaints omitted age, and the public values do not show that age alone caused the losses.
What should someone do after discovering a fraudulent transfer?
The FBI says to contact the financial institution immediately, request a recall and file an IC3 complaint with complete transaction details. Consumers can also report fraud through ReportFraud.ftc.gov and follow current CFPB guidance for unauthorized credit-card charges.
Does this report combine FTC, IC3, CFPB and FinCEN data?
No. The state rankings use FBI IC3 complaint and loss values with Census population denominators. Census income is used in a separate correlation analysis. FTC Consumer Sentinel, CFPB complaints and FinCEN SAR statistics have different submitters, definitions and coverage, so they are cited as separate context and reporting resources, not added to the IC3 figures.
What dates does this report cover?
IC3 complaint and loss inputs cover January 1 through December 31, 2025. State population estimates are for July 1, 2025, and household income is from the 2024 ACS. The report does not use a Q1 2025 through Q1 2026 analysis window or 2026 population estimates.
Where should I report financial fraud?
Contact the financial institution first if money may still be stopped or recalled. Use IdentityTheft.gov for identity theft, complaint.ic3.gov for internet-enabled crime, ReportFraud.ftc.gov for general scams, the CFPB complaint portal for covered financial-company problems, and the USA.gov state Attorney General directory for state consumer-protection contacts. Reporting does not guarantee recovery or investigation.
How to cite this report
Asim Ahmad. “Financial Fraud in America 2026: State Loss Rates, Income, Age and Scam Type.” FinanceFirst Research, version 1.2, August 27, 2026. https://financefirst.co/reports/financial-fraud-by-state-2026
About the author
Asim Ahmad
Founder and Editor
Asim Ahmad is the founder and editor of FinanceFirst, where he leads editorial standards, consumer-finance research, and data-driven financial education.
Continue with practical guidance
Related reading
9 Credit Card Mistakes Quietly Draining Your Money in 2026
Americans pay over $100 billion per year in credit card interest alone. These 9 common mistakes are costing you hundreds or thousands every year, and every single one is fixable today.
How to Start Investing with $500 in 2026: A Complete Beginner's Guide
Start investing with just $500 in 2026. Learn about index funds, ETFs, fractional shares, and Roth IRAs with sample starter portfolios for every risk level.
How to Build an Investment Portfolio in 2026: Asset Allocation by Age with Specific Fund Picks
Stop guessing what to invest in. This step-by-step guide shows you exactly how to build a diversified portfolio matched to your age, with specific low-cost fund picks, the right stock-to-bond ratio at every life stage, and a simple annual rebalancing system that adds up to 0.5% in extra returns.