
FinanceFirst Research
America's Falling Birth Rate: U.S. Fertility & Family Affordability Report 2026
A source-linked U.S. diagnosis of fertility, delayed parenthood, childlessness, family costs, policy evidence and the long-run fiscal clock
Data through U.S. fertility through provisional 2025; final TFR, birth order and first-birth age through 2024; childlessness 2024; BLS childcare CPI through July 2026; state childcare prices through 2022; 2026 CBO, SSA and CMS projectionsLatest official release: September 2, 2026Version 2.0
Executive summary
What this report finds
The U.S. total fertility rate fell to a record-low 1.5995 births per woman in 2024, while the mean age at first birth reached 27.6. This report separates period fertility from completed family size, documents childlessness and birth order, tests financial-pressure claims against preference and timing evidence, adds a transparent 50-state affordability dataset, and examines what family policy, immigration and productivity can and cannot change.
Start here
The 90-Second Briefing
America is having fewer births, and parenthood is happening later. Final CDC data put the 2024 total fertility rate at 1.5995 births per woman, the lowest on record, and the general fertility rate at 53.8 births per 1,000 women ages 15-44. The mean age at first birth reached 27.6. Provisional 2025 data show 3,606,400 births and a general fertility rate of 53.1. [4] [5]
- No single cause has been established. Costs, preferences, partnership, timing, health, work and wider uncertainty overlap.
- Delay is not the same as permanent childlessness. Period rates fall when births move later, even if some occur later.
- Affordability is real but uneven. Historical state child care prices, current income and rent cannot honestly become one causal score.
- Policy outcomes differ. Cash can improve household liquidity and reduce poverty; care and leave can support work; fertility effects are more conditional.
- More births do not repair 2030s trust-fund gaps. Newborns take a generation to enter payroll-tax-paying work.
At a glance
Key findings
- 1.5995↘
Final U.S. TFR in 2024
Record-low period measure; not completed family size
- 53.1↘
Provisional 2025 general fertility rate
Births per 1,000 women ages 15-44
- 27.6↗
Mean age at first birth in 2024
A timing measure, not proof of a birth forgone
- 51.4%↗
2023 births to women age 30 or older
Up from 30.2% in 1990
- 14.9%↘
Women ages 45-50 childless in 2024
Census estimate; 16.7% in 2014
- 48 of 50↔
States with observed DOL infant-care prices
Latest nonmissing through 2022; two remain missing
- 20.7%↗
National childcare CPI rise
2022 annual index to July 2026; context, not a state quote
- 2034↔
Combined Social Security depletion in all tested TFR cases
Fertility affects the long run more than the near term
- 2033 Q2↔
Projected Medicare HI depletion
89% of costs payable in the depletion year
- No single cause↔
Best-supported national conclusion
Preferences, timing, partnership, health and costs overlap
Definitions readers asked us to clarify
Questions readers asked
Is this annual fertility or completed family size?
Annual GFR and TFR are period measures. Completed cohort fertility is a different endpoint.
Is this observed, surveyed, studied, projected or modeled?
Each major claim is classified and its source context retained.
Does a policy improve poverty, work or fertility?
These are separate outcomes and should be evaluated separately.
Is the state price current?
Observed DOL values are historical through 2022; national CPI context remains separately labeled.
Ungated research data
Download the 50-state family affordability and fertility dataset
All 50 states with labeled source years, observed and missing child care prices, separately labeled national CPI context, income, rent, births, GFR change and PFML status. No composite rank.
Table of contents
- The 90-Second Briefing
- How to Read the Evidence
- America's Fertility Trend, 1990 to 2025
- Delayed Parenthood Is a Central Part of the Story
- Childlessness Rises at Younger Ages, but Delay Changes the Meaning
- Birth Order Shows Which Family-Formation Margin Is Moving
- Preferences and Affordability Overlap
- What the Newest Research Adds
- The Family-Cost Problem Is Real, but It Is Not One Number
- The 50-State Family Affordability Dashboard
- A Better Way to Handle Old Child Care Prices
- What Households Can Do With This Evidence
- Judge Family Policy by the Outcome It Targets
- Interactive U.S. Family Policy Cost Calculator
- What Would Illustrative U.S. Benefits Cost?
- What Cash, Leave, Care and Housing Evidence Can Support
- International Evidence Is a Stress Test, Not a U.S. Forecast
- Singapore's 2026 Package: Useful Design, Unknown Fertility Effect
- Low Fertility Matters on a Long Fiscal and Workforce Clock
- Social Security: Fertility Changes the Long Run, Not the 2030s
- Immigration, Participation and Productivity Work on Different Clocks
- Medicare Is an Aging and Health-Cost Story
- What We Still Do Not Know
- Journalist and Researcher Resources
- Methodology, Reproducibility and Citation Rules
- Sources
How to Read the Evidence
This report uses six claim classes: observed statistic, survey response, study result, official projection, FinanceFirst calculation and FinanceFirst scenario. They are not interchangeable.
| Measure | What it tells us | What it does not tell us |
|---|---|---|
| General fertility rate | Births in a year per 1,000 women ages 15-44 | Completed family size |
| Total fertility rate | Births a hypothetical woman would have if current age-specific rates persisted | A forecast for one person or cohort |
| Childlessness by age | Share without a live birth at the survey date | Permanent childlessness at younger ages |
| Expected births | What respondents expect at that time | Births that will certainly occur |
| Completed cohort fertility | Lifetime births after most childbearing years | Current annual conditions |
America's Fertility Trend, 1990 to 2025
The U.S. general fertility rate fell from 70.9 in 1990 to 53.8 in 2024. CDC reported a final 2024 TFR of 1.5995, down 23% from 2008. The 2025 GFR of 53.1 is provisional. [4] [5] [35]
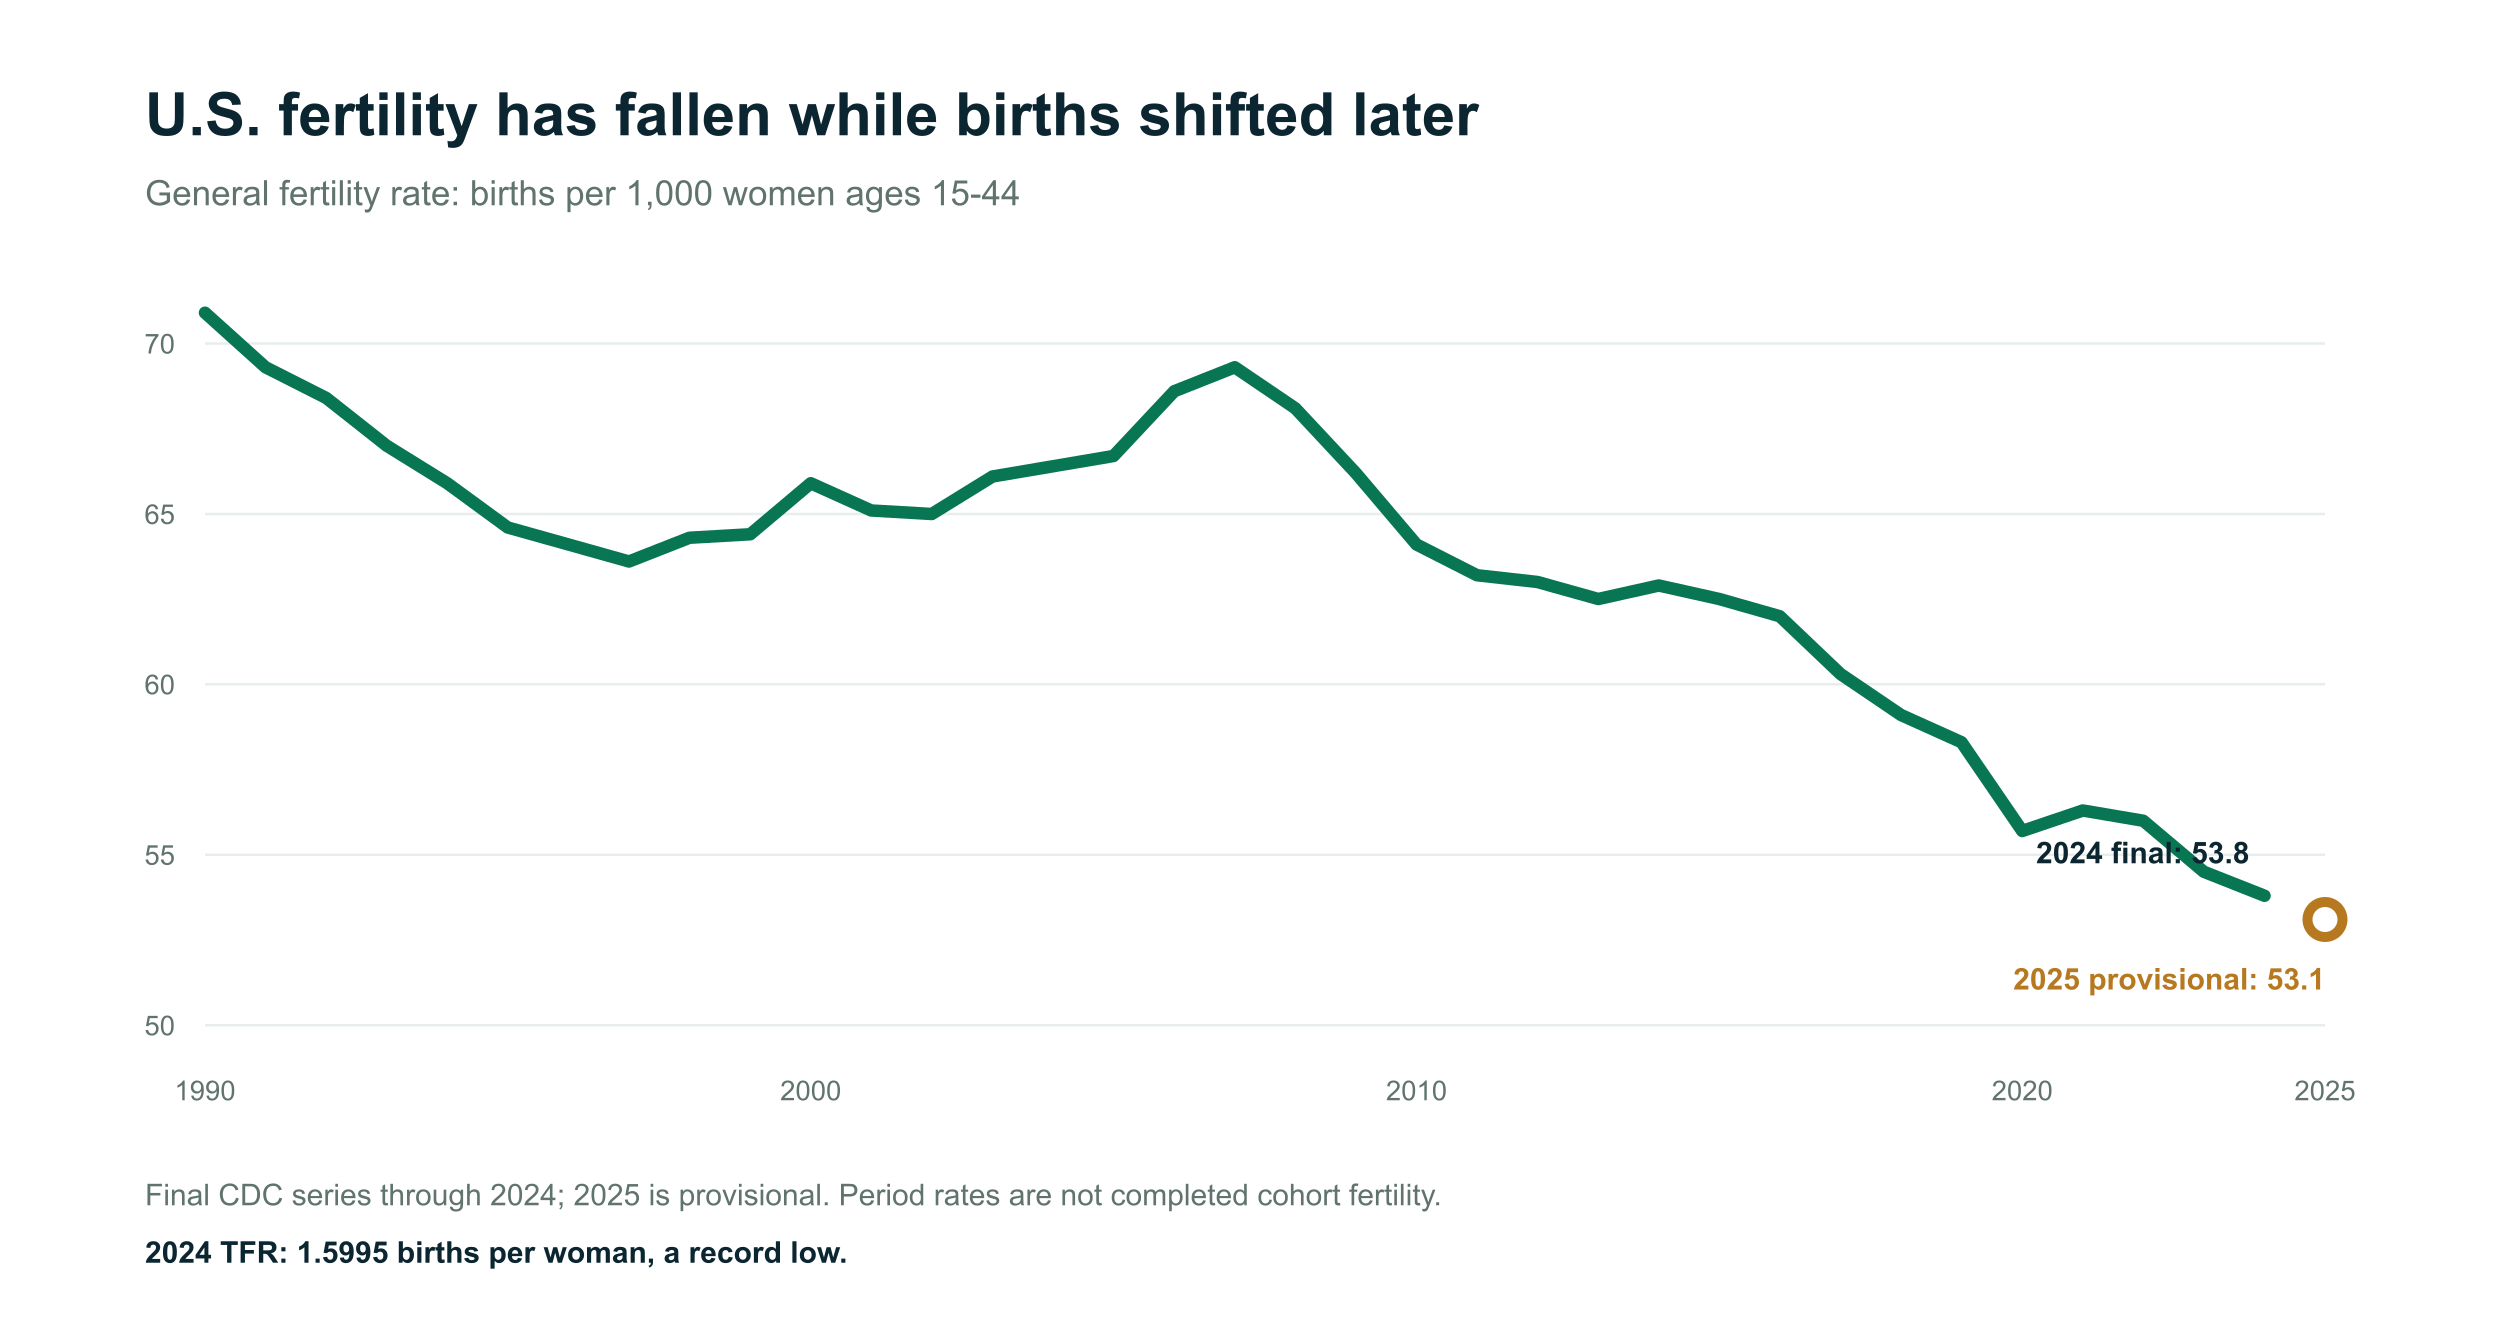
The decline was not a straight line. Rates rose into 2007, fell sharply around the Great Recession, and mostly continued lower afterward. A peer-reviewed review finds that the recession explains the initial drop better than the sustained decline. [33]
Delayed Parenthood Is a Central Part of the Story
The mean age at first birth rose from 25.4 in 2010 to a record 27.6 in 2024. First-birth rates fell for women ages 15-29 in 2024 and rose for ages 30-44. [5]
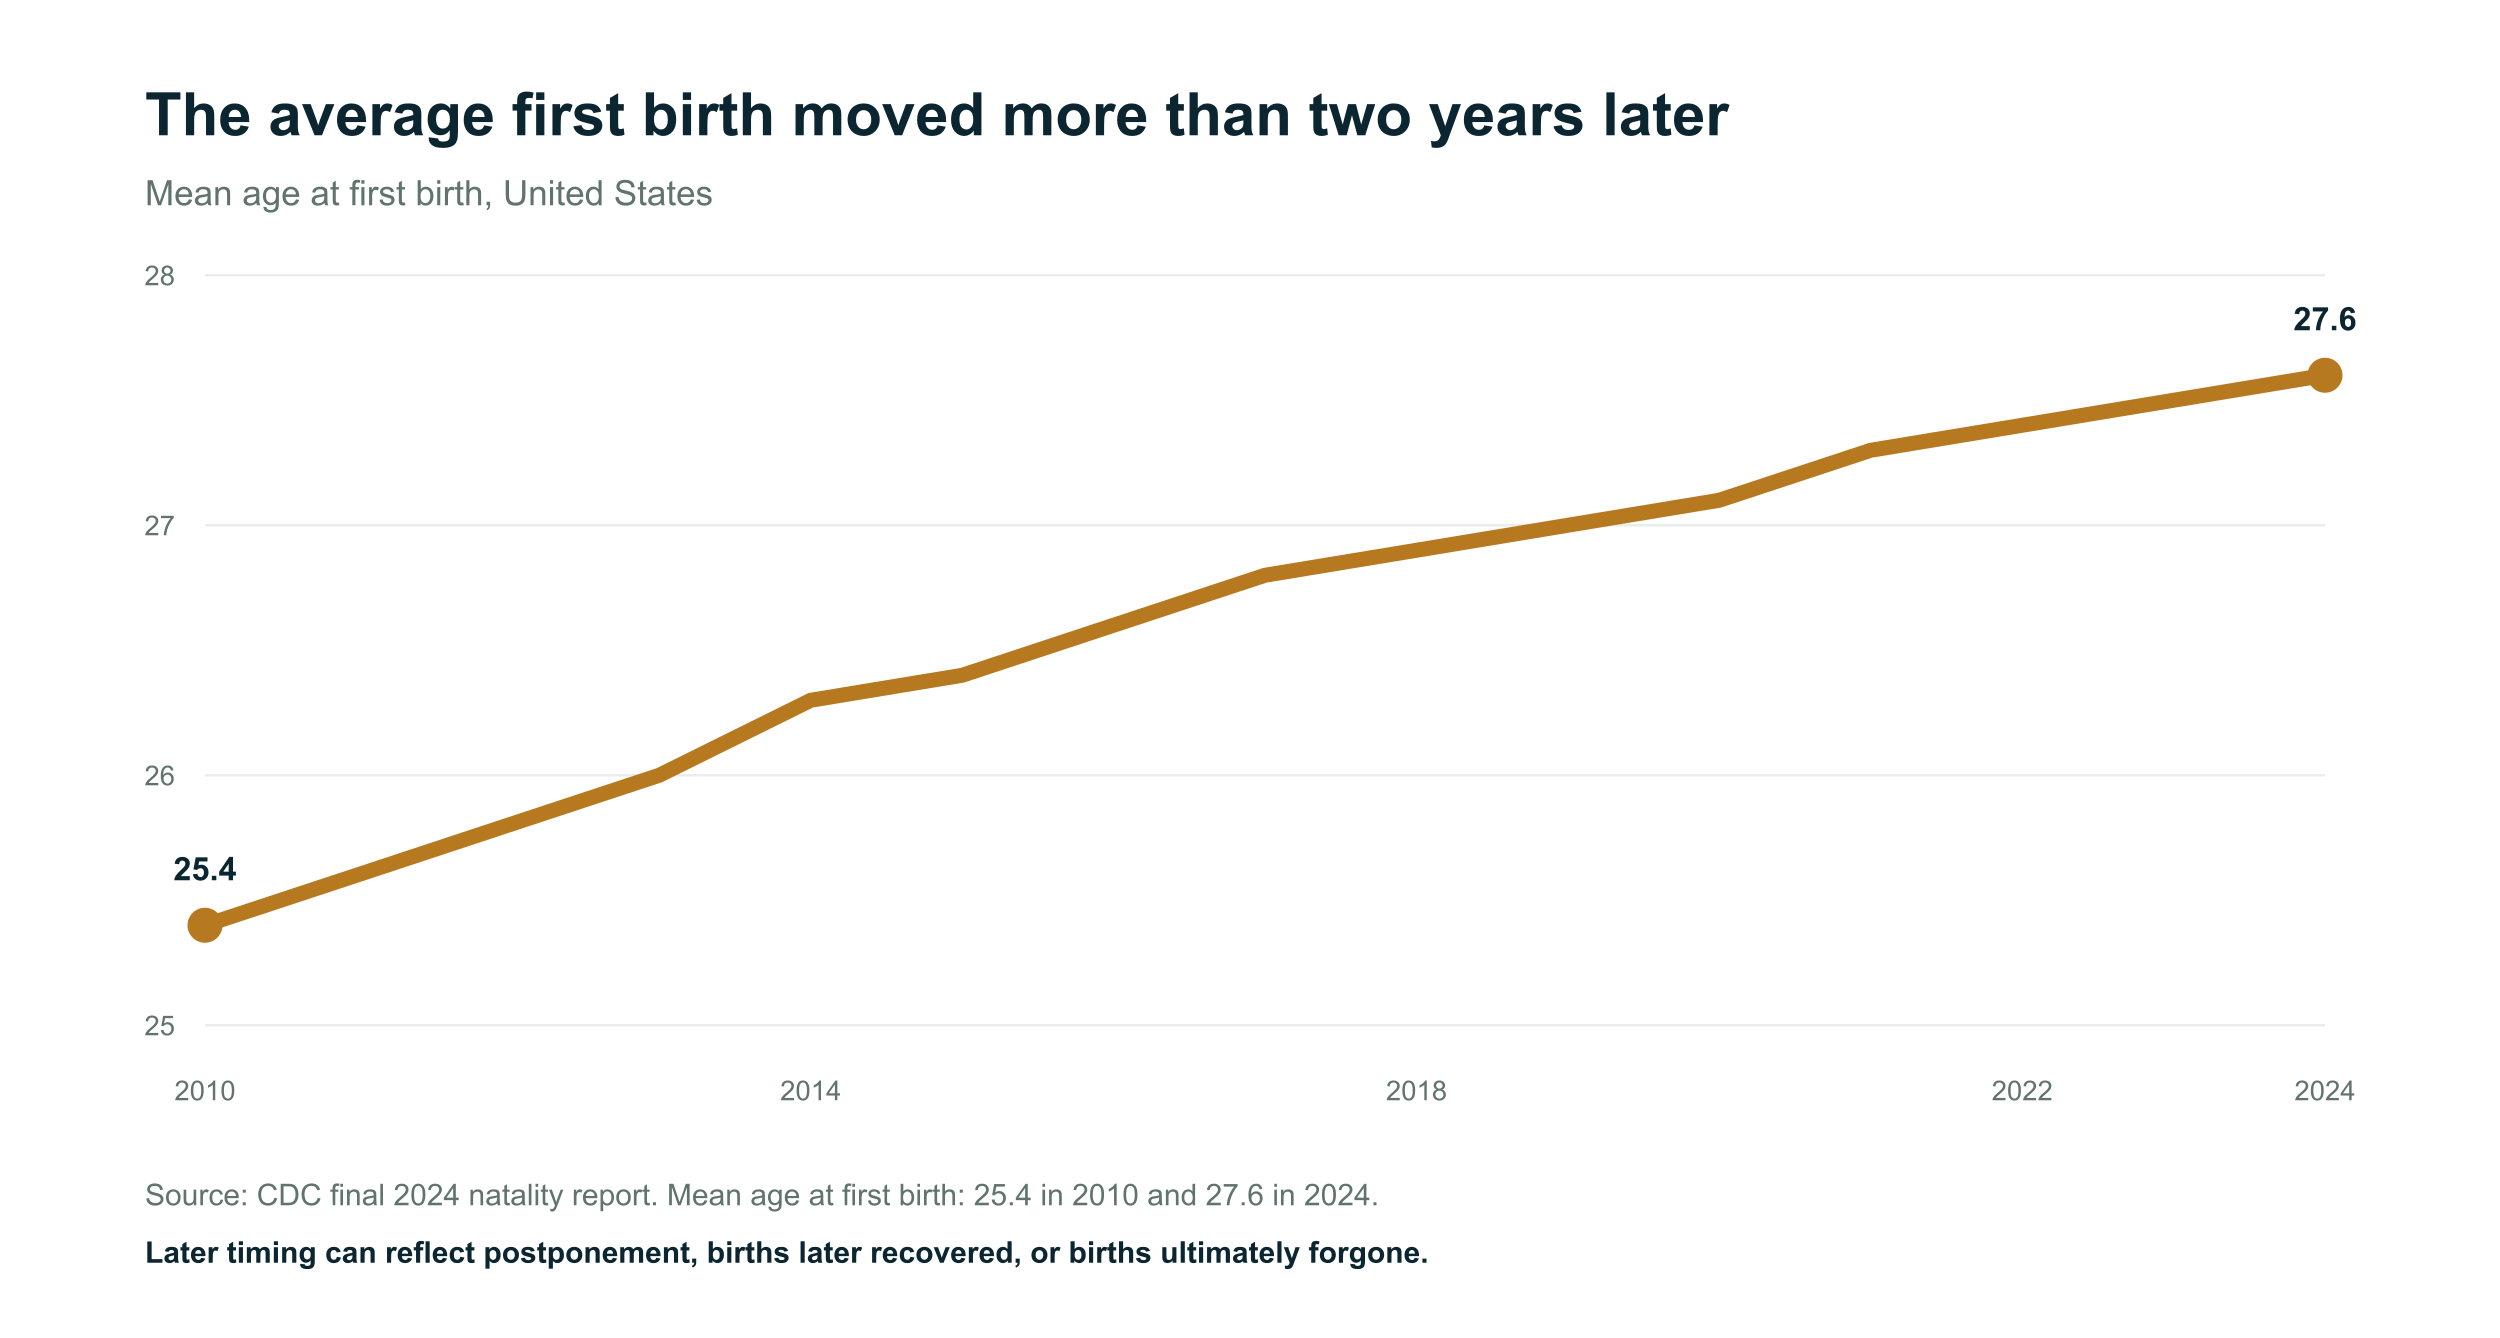
CDC''s longer analysis found the share of births to women age 30 or older rose from 30.2% in 1990 to 51.4% in 2023. Births fell 73% among teenagers and 44% among ages 20-24, while increasing 90% among ages 35-39 and 193% among ages 40 and older. [35]
Childlessness Rises at Younger Ages, but Delay Changes the Meaning
In 2024, Census estimated that 40.2% of women ages 30-34, 23.1% of ages 35-39 and 18.8% of ages 40-44 were childless. At ages 45-50, the share was 14.9%, down from 16.7% in 2014. [36] [42]
Census also warns that a 2012 processing change affects long-run comparisons. The report publishes the age-specific values and the warning together.
Birth Order Shows Which Family-Formation Margin Is Moving
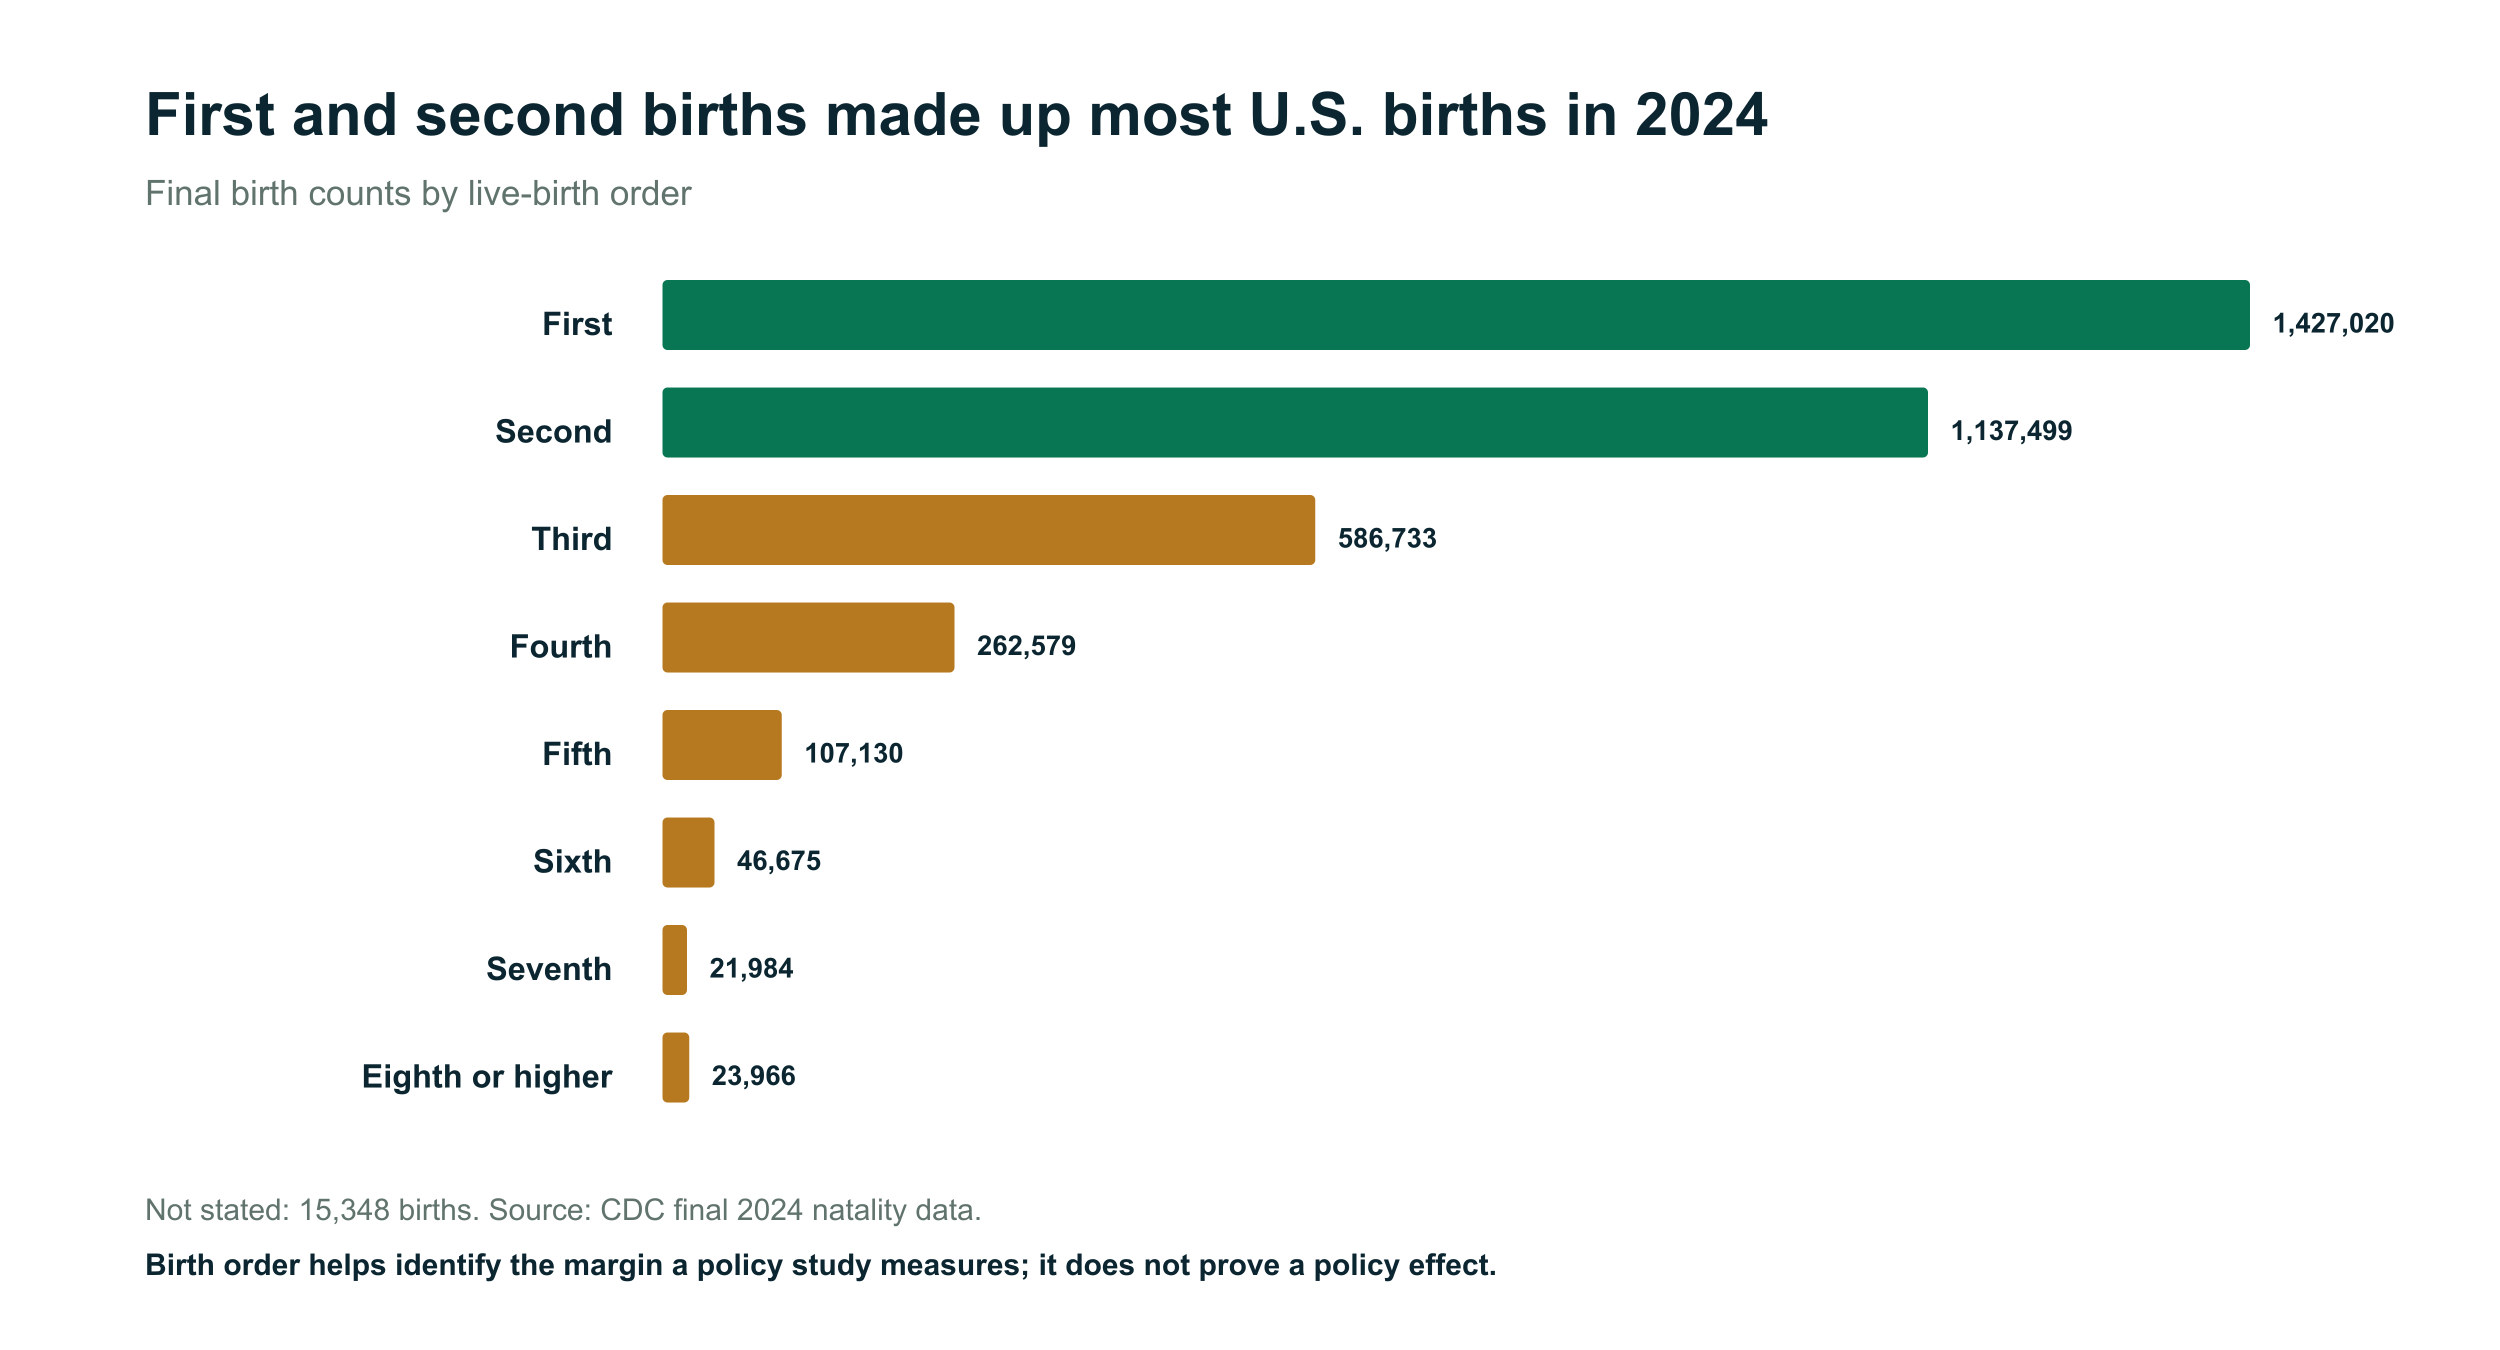
Of 3,628,934 final U.S. births in 2024, 1,427,020 were first births and 1,137,499 were second births. Third births totaled 586,733, with progressively fewer at higher orders. [5]
Preferences and Affordability Overlap
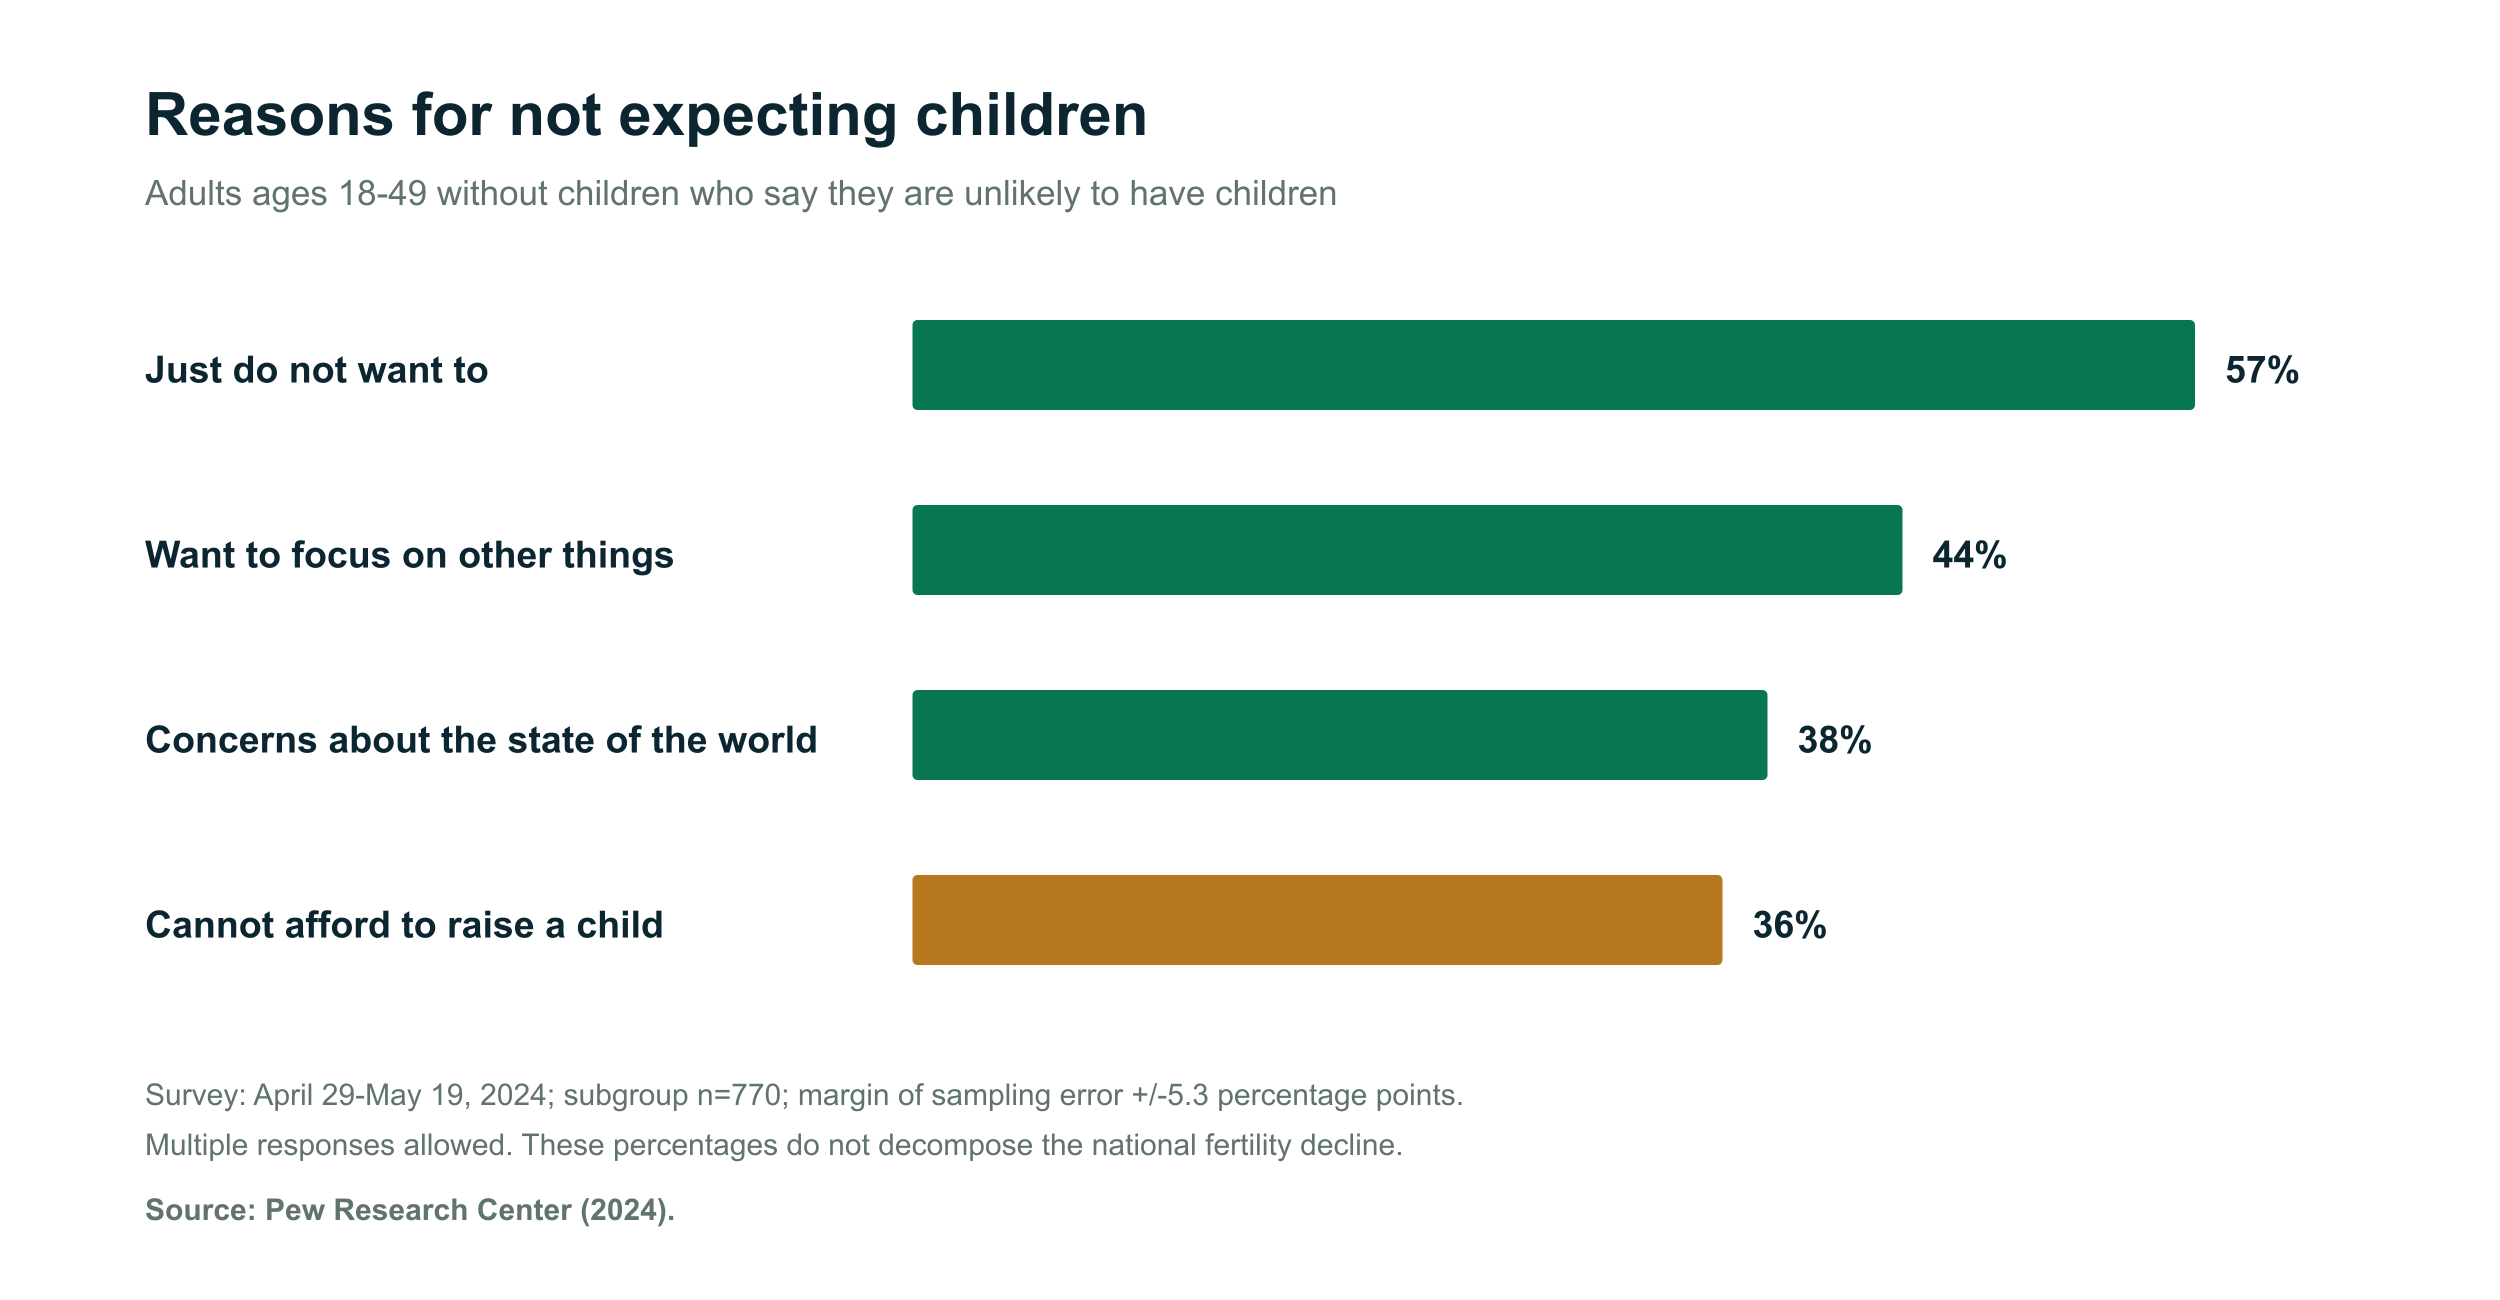
Pew surveyed a specific group in 2024: adults ages 18-49 without children who said they were unlikely to have children. Among that subgroup, 57% cited not wanting children as a major reason, 44% focusing on other things, 38% the state of the world and 36% inability to afford raising a child. Respondents could select more than one reason. The subgroup contained 770 people and had a margin of sampling error of plus or minus 5.3 percentage points. [28] [29]
What the Newest Research Adds
Kearney, Levine and Pardue''s 2022 peer-reviewed review found that no single post-2007 economic, policy or social factor explains the continued broad decline. Kearney and Levine''s 2026 literature review places cohort fertility and childlessness in a wider model of norms, work, parenting, gender roles, consumption and leisure. [33] [37]
An Atlanta Fed 2026 working paper models cohort patterns in parity, stated desire and impaired fecundity. It finds that younger cohorts are less likely to have had a child at observed ages, while a dramatic desire decline appears only for the youngest Gen Z group. The paper is not peer reviewed, the youngest cohorts are incomplete, and its discussion is suggestive rather than causal. [38]
Download the study registry with bounded findings and causal limits.
The Family-Cost Problem Is Real, but It Is Not One Number
Housing, child care, health care, leave, transportation and forgone earnings arrive at different times and affect households differently. Median rent plus median child care is not the budget of a median household, because the medians come from different populations and years.
Historical U.S. housing research found opposite channels: higher prices were associated with fewer births among renters or nonowners and a positive wealth channel among homeowners. That finding argues against one national housing-to-fertility coefficient. [25]
Related FinanceFirst work covers housing affordability and mortgage lock-in, the cost-of-living benchmark and the cost of raising a child.
The 50-State Family Affordability Dashboard
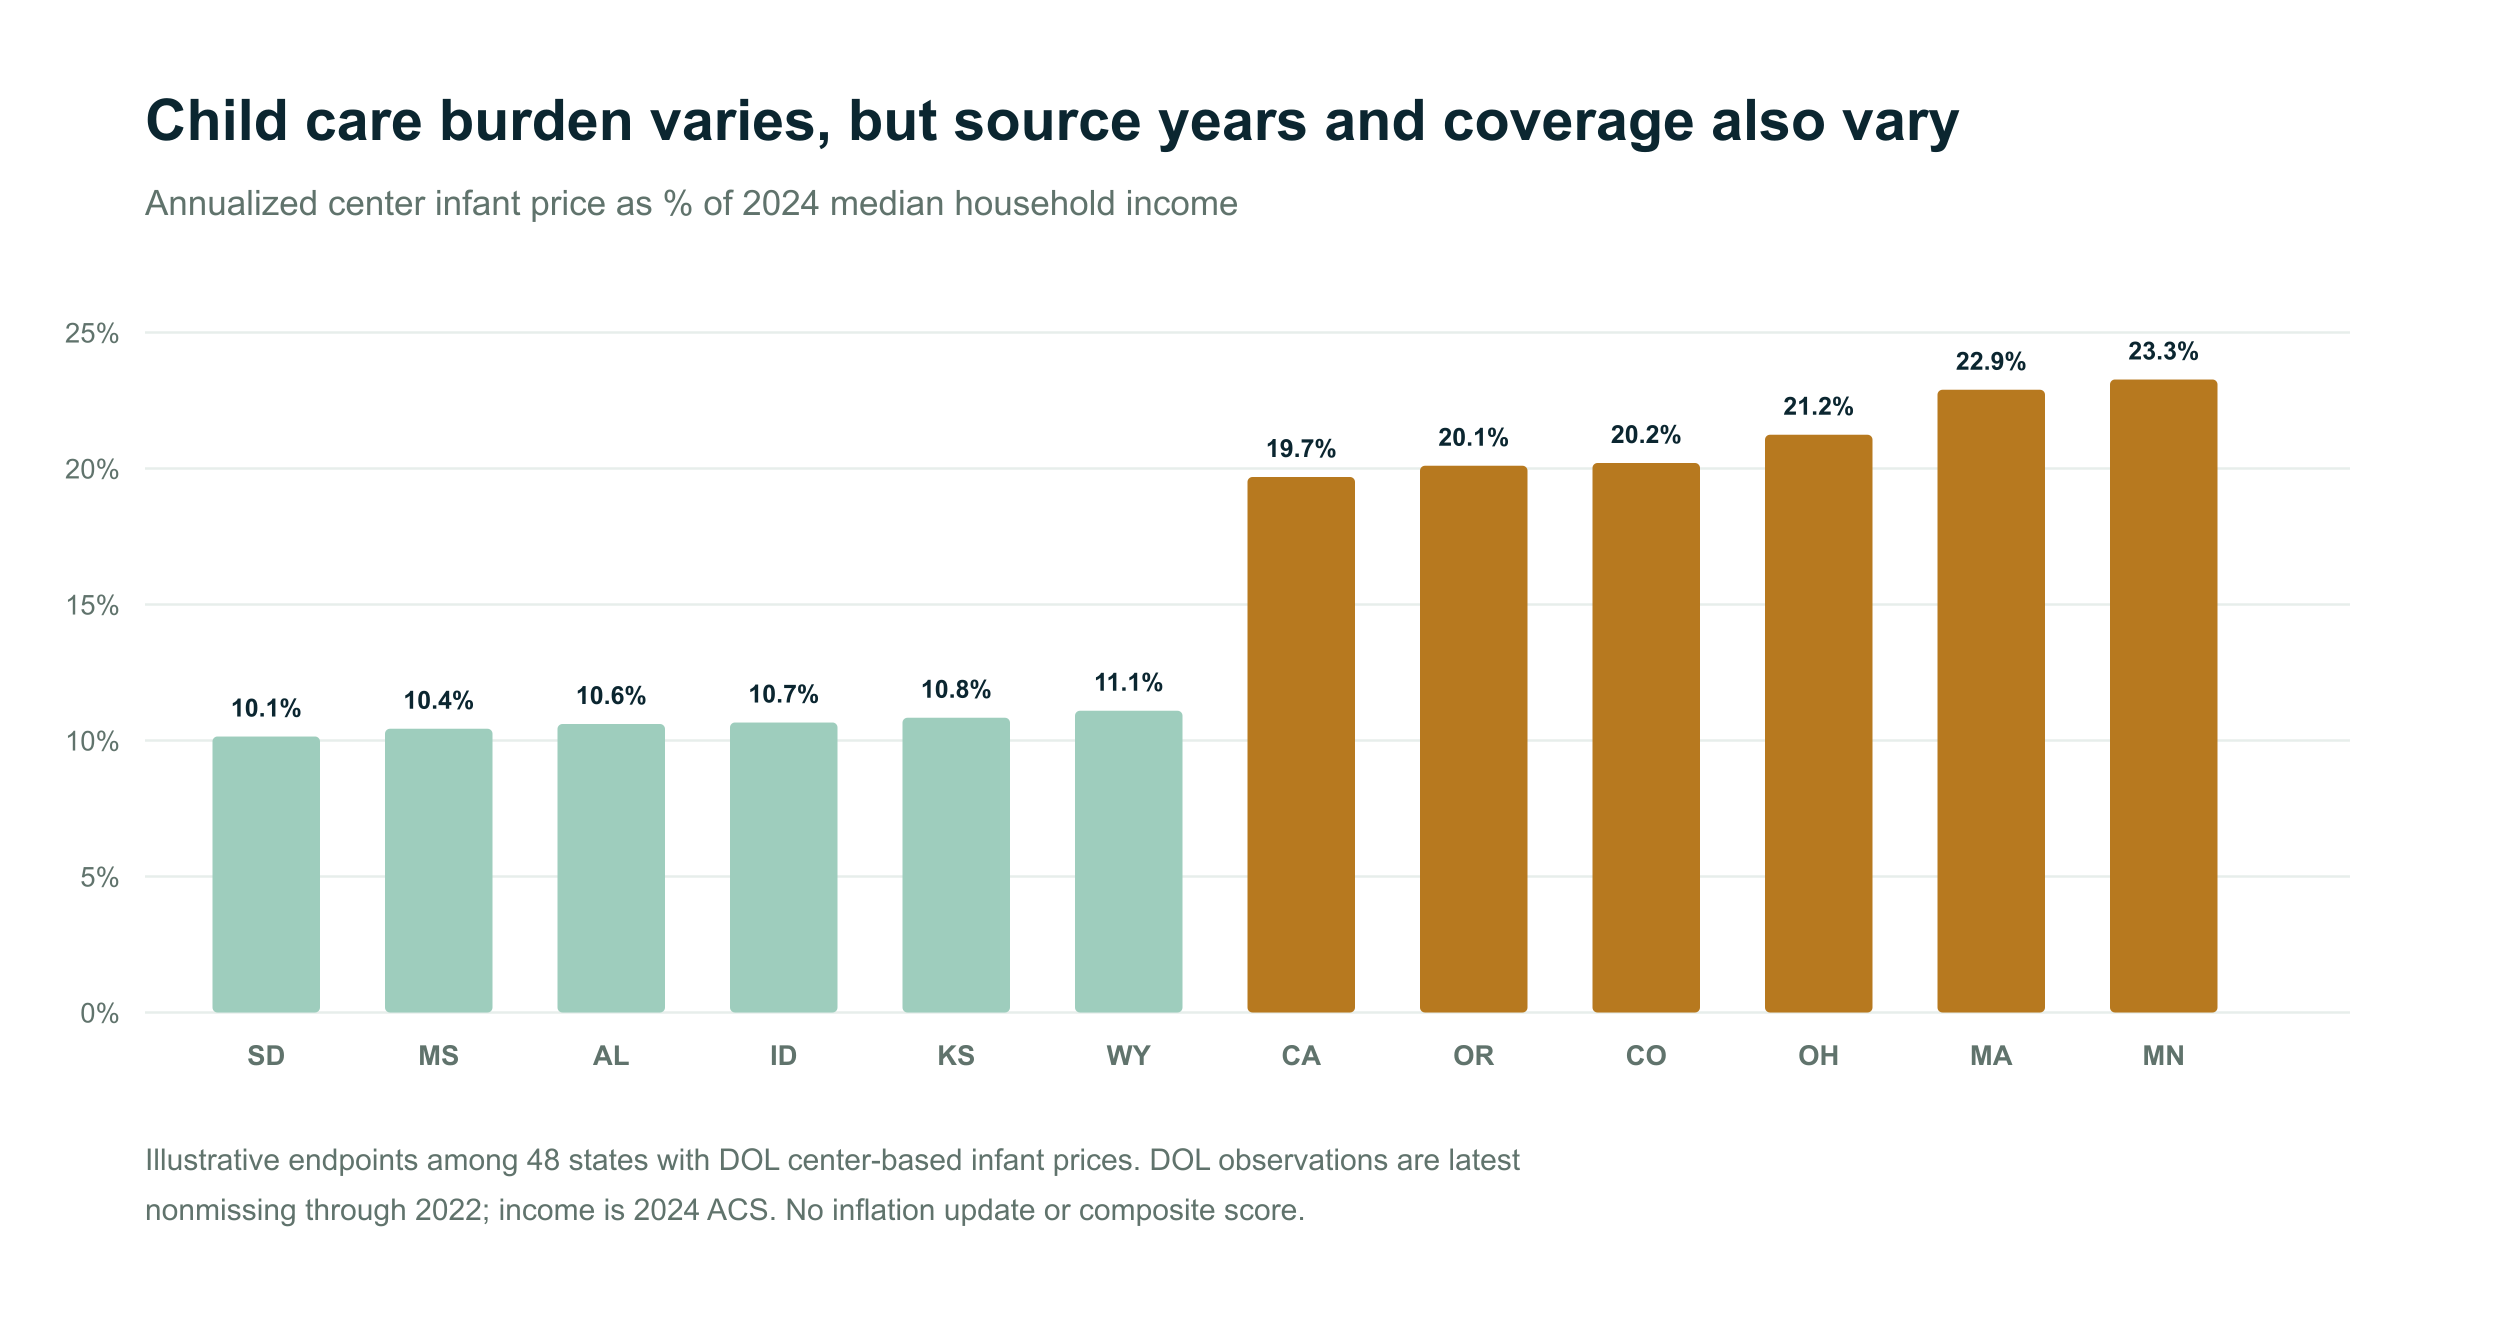
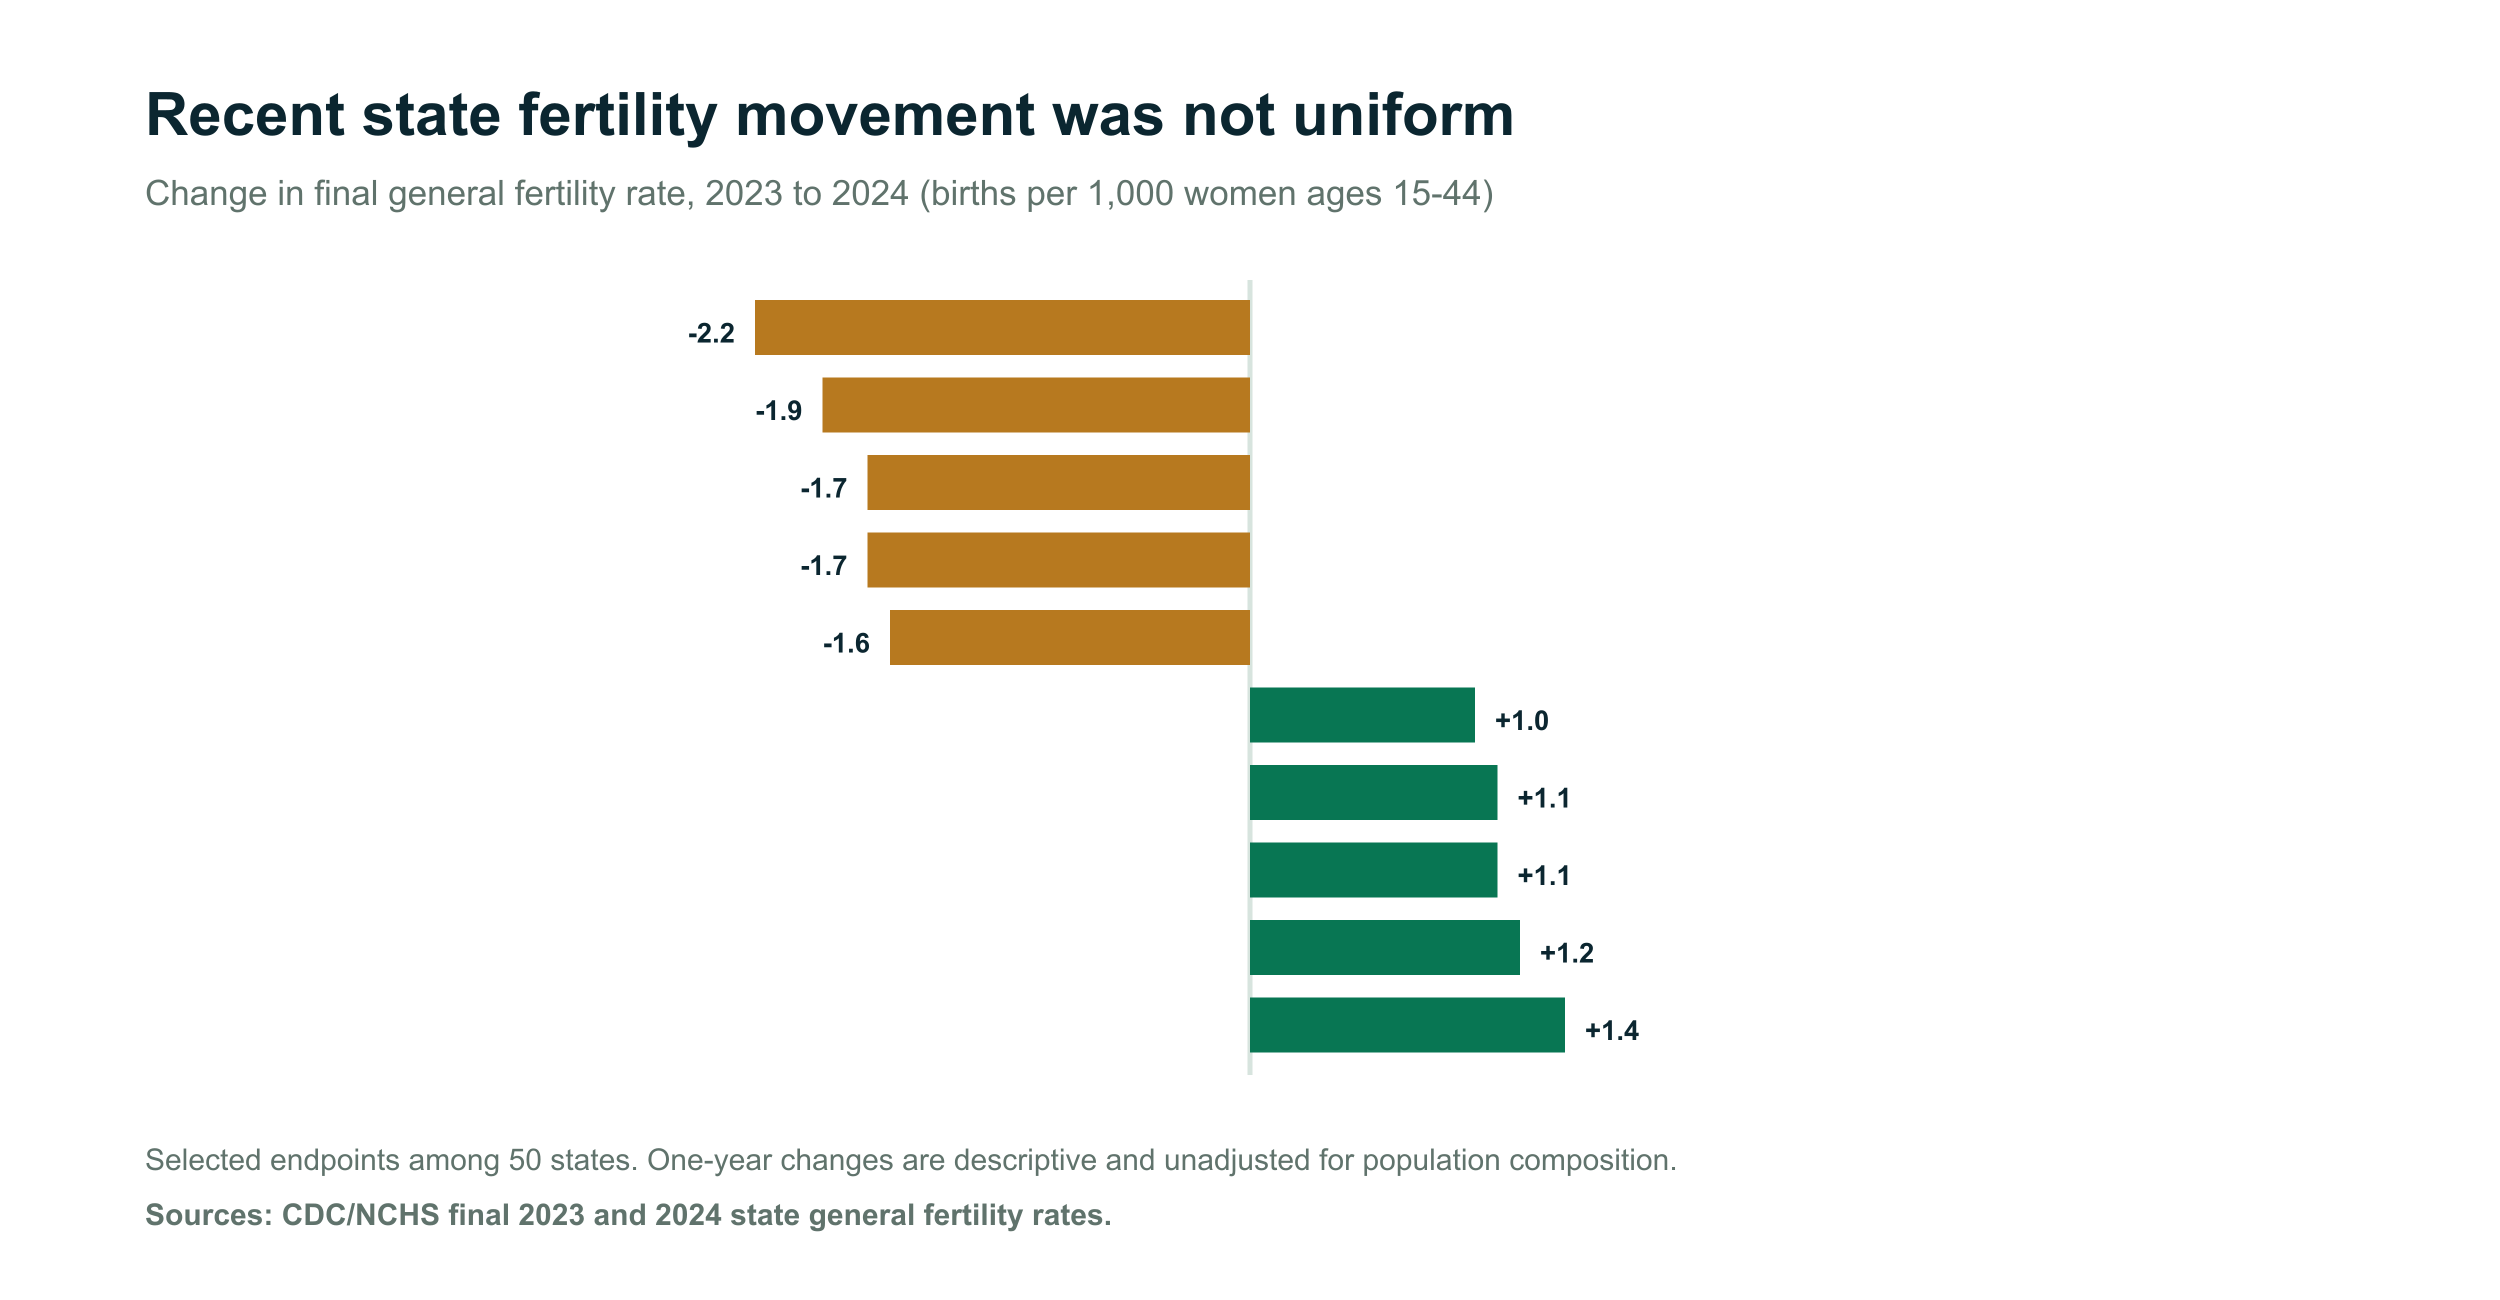
The dashboard contains final 2023 and 2024 state GFRs, 2024 births, 2024 ACS income and rent, the latest nonmissing DOL center-based infant price through 2022, and enacted state paid-family-and-medical-leave status. It deliberately has no composite score. [6] [7] [9] [10] [32]
50-state evidence table
Compare affordability inputs, not a composite rank
All 50 states are included. Child care has 48 observed values and two explicit blanks. Sorting changes the question, not the underlying data.
Find your state
Alabama citation-ready snapshot
Alabama's latest available DOL center-based infant price is $7,073 a year (2022). A national BLS index translation to July 2026 is $8,538, but that is not a current state quote. The 2024 ACS median household income is $66,659 and median gross rent is $1,077 a month. The final CDC general fertility rate changed from 57.9 in 2023 to 57.2 in 2024 (-0.7 rate points). DOL does not list an enacted state PFML law.
Suggested citation: FinanceFirst analysis of DOL National Database of Childcare Prices, U.S. Census Bureau 2024 ACS and CDC/NCHS final 2023-2024 state fertility data. The benchmark combines separate state medians and is not an actual household budget.
| State | DOL year | Infant care / year | July 2026 CPI context | Care / income | Rent + care benchmark | Median income | Median rent / month | 2024 births | GFR | GFR change | PFML law | Price coverage |
|---|---|---|---|---|---|---|---|---|---|---|---|---|
| Alabama AL | 2022 | $7,073 | $8,538 | 10.6% | 30% | $66,659 | $1,077 | 57,934 | 57.2 | -0.7 | No state law listed | 100% |
| Alaska AK | 2022 | $18,819 | $22,719 | 19.7% | 37.8% | $95,665 | $1,444 | 8,943 | 60.8 | -1.6 | No state law listed | 53.5% |
| Arizona AZ | 2022 | $14,040 | $16,950 | 17.2% | 41.9% | $81,486 | $1,672 | 78,711 | 53.2 | -1 | No state law listed | 100% |
| Arkansas AR | 2021 | $7,670 | $9,626 | 12.3% | 31.3% | $62,106 | $982 | 35,395 | 58.8 | -0.4 | No state law listed | 98.1% |
| California CA | 2022 | $19,719 | $23,806 | 19.7% | 44.9% | $100,149 | $2,104 | 402,075 | 49.8 | -0.6 | Enacted | 100% |
| Colorado CO | 2022 | $19,625 | $23,692 | 20.2% | 42.7% | $97,113 | $1,822 | 64,268 | 51.6 | +1.4 | Enacted | 100% |
| Connecticut CT | 2022 | $18,200 | $21,972 | 18.9% | 38.3% | $96,049 | $1,550 | 34,599 | 48.9 | -1.3 | Enacted | 100% |
| Delaware DE | 2022 | $14,575 | $17,595 | 16.7% | 37.6% | $87,534 | $1,530 | 10,550 | 53.7 | -0.7 | Enacted | 100% |
| Florida FL | 2022 | $11,700 | $14,125 | 15.1% | 43% | $77,735 | $1,812 | 224,389 | 52.2 | -1.7 | No state law listed | 98.9% |
| Georgia GA | 2022 | $10,660 | $12,869 | 13.3% | 35.9% | $79,991 | $1,506 | 126,437 | 54.7 | -0.2 | No state law listed | 100% |
| Hawaii HI | 2022 | $19,020 | $22,962 | 18.9% | 42% | $100,745 | $1,942 | 14,917 | 56.6 | -0.3 | No state law listed | 95.2% |
| Idaho ID | 2022 | $8,653 | $10,447 | 10.7% | 31.1% | $81,166 | $1,384 | 23,276 | 58.6 | +1 | No state law listed | 100% |
| Illinois IL | 2022 | $14,473 | $17,473 | 17.4% | 36.5% | $83,211 | $1,322 | 125,731 | 49.7 | -0.7 | No state law listed | 93.6% |
| Indiana IN | Missing | Not available | Not available | Not available | Not available | $71,959 | $1,104 | 80,257 | 59.1 | +0.2 | No state law listed | Not available |
| Iowa IA | 2022 | $8,631 | $10,420 | 11.4% | 27% | $75,501 | $981 | 36,436 | 58.8 | -0.2 | No state law listed | 100% |
| Kansas KS | 2022 | $8,181 | $9,877 | 10.8% | 28% | $75,514 | $1,079 | 33,984 | 58.3 | -1.2 | No state law listed | 100% |
| Kentucky KY | 2022 | $7,868 | $9,498 | 12.2% | 30.8% | $64,526 | $998 | 52,913 | 60.3 | -0.1 | No state law listed | 100% |
| Louisiana LA | 2022 | $7,973 | $9,626 | 13.1% | 34% | $60,986 | $1,064 | 53,305 | 58.2 | -2.2 | No state law listed | 100% |
| Maine ME | 2022 | $11,960 | $14,439 | 15.6% | 34.6% | $76,442 | $1,210 | 11,601 | 46.3 | -0.7 | Enacted | 100% |
| Maryland MD | 2022 | $17,024 | $20,553 | 16.5% | 36.6% | $102,905 | $1,721 | 65,797 | 53.3 | -0.8 | Enacted | 100% |
| Massachusetts MA | 2022 | $24,001 | $28,975 | 22.9% | 44% | $104,828 | $1,848 | 68,184 | 46.8 | -0.6 | Enacted | 100% |
| Michigan MI | 2022 | $9,006 | $10,873 | 12.4% | 31.8% | $72,389 | $1,168 | 99,525 | 51.5 | -0.7 | No state law listed | 100% |
| Minnesota MN | 2022 | $20,280 | $24,483 | 23.3% | 41.1% | $87,117 | $1,291 | 62,110 | 55.2 | -0.5 | Enacted | 100% |
| Mississippi MS | 2022 | $6,171 | $7,450 | 10.4% | 30.5% | $59,127 | $990 | 33,473 | 57.3 | -1.9 | No state law listed | 100% |
| Missouri MO | 2020 | $11,177 | $14,290 | 15.6% | 33.5% | $71,589 | $1,067 | 67,998 | 55.9 | +0.1 | No state law listed | 52.1% |
| Montana MT | 2022 | $11,482 | $13,862 | 15.2% | 34% | $75,340 | $1,177 | 11,331 | 53.3 | +1.1 | No state law listed | 100% |
| Nebraska NE | 2022 | $12,675 | $15,302 | 16.6% | 33.9% | $76,376 | $1,102 | 24,785 | 62.9 | +0.4 | No state law listed | 100% |
| Nevada NV | 2022 | $14,333 | $17,303 | 17.7% | 42.9% | $81,134 | $1,709 | 32,381 | 50.1 | -0.7 | No state law listed | 100% |
| New Hampshire NH | 2022 | $15,603 | $18,836 | 15.6% | 34.4% | $99,782 | $1,558 | 11,770 | 45.9 | -0.9 | No state law listed | 100% |
| New Jersey NJ | 2022 | $16,314 | $19,695 | 15.6% | 36.4% | $104,294 | $1,800 | 101,372 | 55.7 | -1.7 | Enacted | 100% |
| New Mexico NM | Missing | Not available | Not available | Not available | Not available | $67,816 | $1,117 | 21,328 | 51.9 | +0.4 | No state law listed | Not available |
| New York NY | 2022 | $15,600 | $18,833 | 18.2% | 41% | $85,820 | $1,634 | 205,489 | 52.1 | -0.6 | Enacted | 100% |
| North Carolina NC | 2022 | $10,531 | $12,714 | 14.2% | 35.9% | $73,958 | $1,338 | 122,856 | 55.8 | -0.2 | No state law listed | 100% |
| North Dakota ND | 2022 | $11,118 | $13,422 | 14.3% | 29.4% | $77,871 | $980 | 9,634 | 60.4 | -1.6 | No state law listed | 100% |
| Ohio OH | 2022 | $15,340 | $18,519 | 21.2% | 39.4% | $72,212 | $1,090 | 126,795 | 55.6 | -0.8 | No state law listed | 100% |
| Oklahoma OK | 2022 | $11,204 | $13,526 | 16.9% | 35.9% | $66,148 | $1,044 | 47,962 | 58.4 | -0.7 | No state law listed | 100% |
| Oregon OR | 2022 | $17,131 | $20,681 | 20.1% | 42.6% | $85,220 | $1,597 | 38,963 | 46.1 | +0.2 | Enacted | 100% |
| Pennsylvania PA | 2020 | $11,331 | $14,487 | 14.6% | 34% | $77,545 | $1,252 | 127,299 | 51.2 | -0.7 | No state law listed | 100% |
| Rhode Island RI | 2022 | $15,059 | $18,180 | 18% | 38.4% | $83,504 | $1,418 | 10,009 | 45 | -0.2 | Enacted | 100% |
| South Carolina SC | 2022 | $10,344 | $12,488 | 14.3% | 35.4% | $72,350 | $1,272 | 58,768 | 55.5 | -0.3 | No state law listed | 100% |
| South Dakota SD | 2022 | $7,800 | $9,417 | 10.1% | 25.7% | $76,881 | $999 | 11,451 | 66.7 | +1.1 | No state law listed | 100% |
| Tennessee TN | 2022 | $11,007 | $13,288 | 15.3% | 36.7% | $71,997 | $1,284 | 83,833 | 58.5 | -0.4 | No state law listed | 100% |
| Texas TX | 2022 | $9,620 | $11,614 | 12.1% | 34.3% | $79,721 | $1,475 | 390,828 | 59.3 | -1.3 | No state law listed | 100% |
| Utah UT | 2022 | $11,766 | $14,205 | 12.2% | 31.9% | $96,658 | $1,593 | 46,664 | 59.9 | +0.3 | No state law listed | 100% |
| Vermont VT | 2021 | $16,282 | $20,434 | 19.7% | 38.8% | $82,730 | $1,319 | 5,023 | 41.7 | -0.4 | No state law listed | 100% |
| Virginia VA | 2022 | $12,829 | $15,488 | 13.9% | 35.4% | $92,090 | $1,646 | 94,054 | 53.7 | +0.1 | No state law listed | 100% |
| Washington WA | 2022 | $18,580 | $22,431 | 18.7% | 40.7% | $99,389 | $1,824 | 83,118 | 51.3 | -0.1 | Enacted | 100% |
| West Virginia WV | 2022 | $8,709 | $10,515 | 14.3% | 31.8% | $60,798 | $883 | 17,022 | 54.3 | +1.2 | No state law listed | 100% |
| Wisconsin WI | 2022 | $15,236 | $18,394 | 19.7% | 37.3% | $77,488 | $1,142 | 59,686 | 52.8 | -0.8 | No state law listed | 100% |
| Wyoming WY | 2022 | $8,381 | $10,118 | 11.1% | 27% | $75,532 | $998 | 6,089 | 54.8 | +0.3 | No state law listed | 98.7% |
A Better Way to Handle Old Child Care Prices
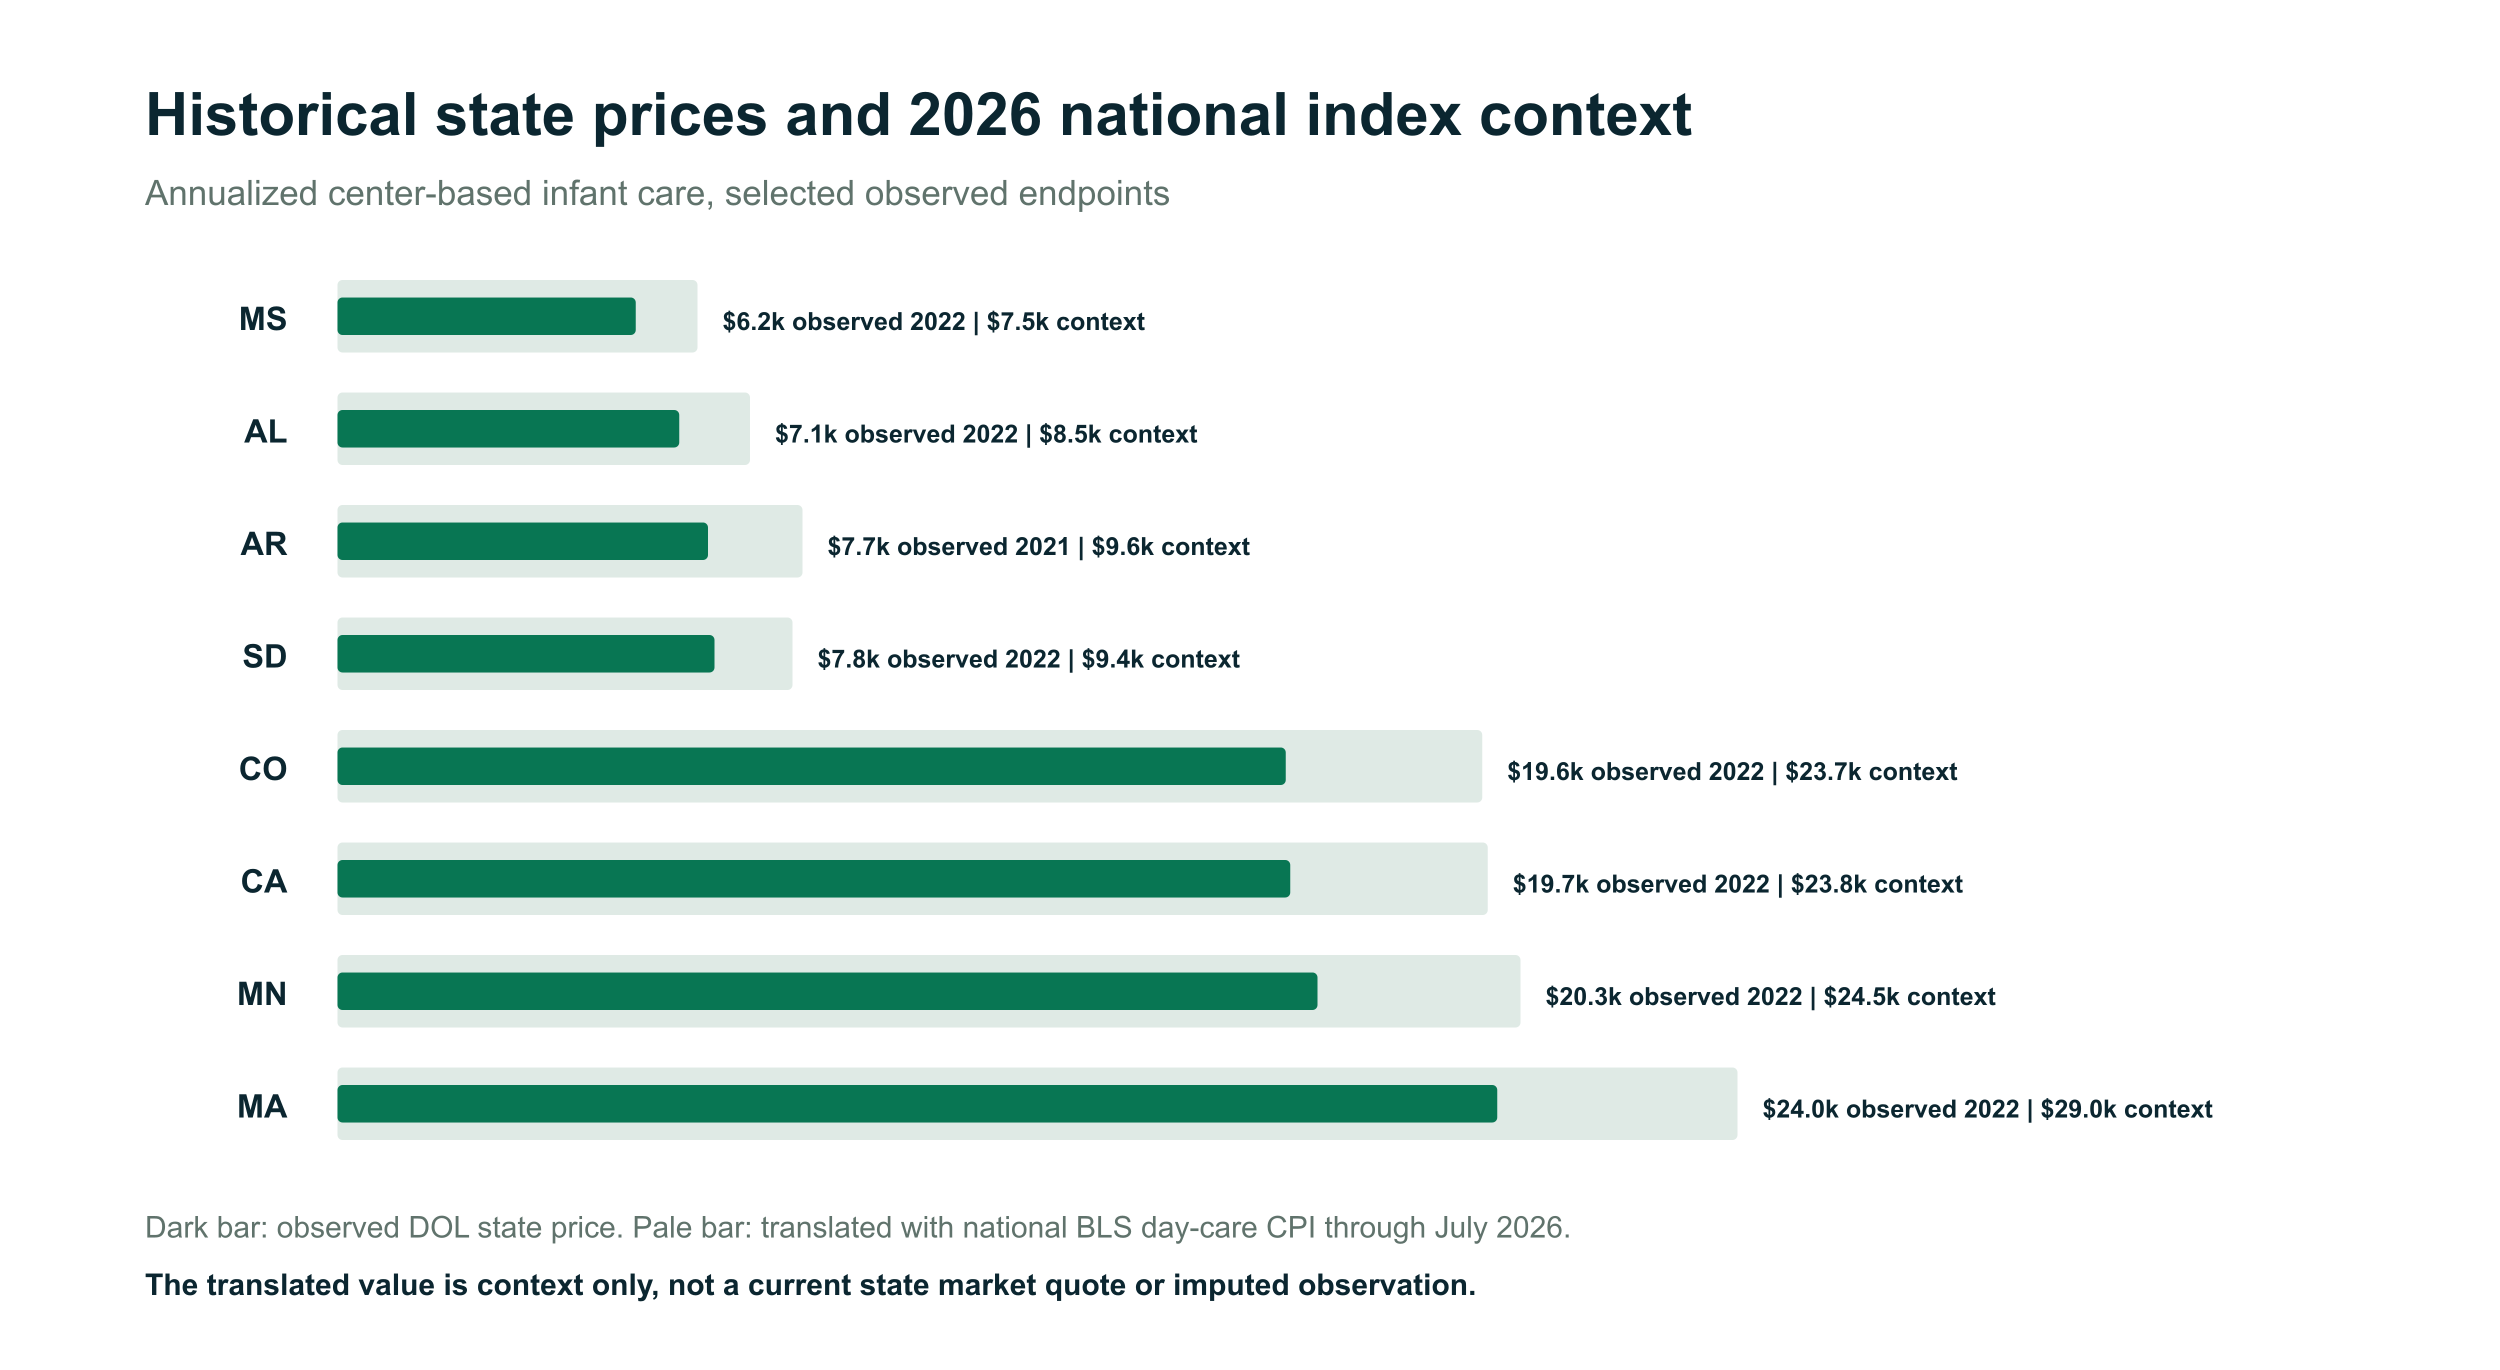
DOL state prices end in 2022 and some state observations are older. FinanceFirst preserves those observed values and adds a separately labeled national CPI context translation through July 2026 using BLS series CUUR0000SEEB03. From the 2022 annual index to July 2026, the national day-care and preschool index rose about 20.7%. [7] [39]
What Households Can Do With This Evidence
- Build a first-year cash-flow plan that separates one-time purchases from monthly care, housing and insurance.
- Price actual local care slots and waitlists. A state median is context, not a quote.
- Check employer leave, FMLA eligibility, state PFML, insurance deductibles and tax-credit eligibility separately.
- Stress-test reduced hours or an unpaid-leave period, even when the preferred plan is a quick return to work.
- Keep emergency savings and retirement contributions visible. A new child changes both liquidity and the long horizon.
Useful tools include the budget calculator, emergency-fund calculator and retirement-savings calculator.
Judge Family Policy by the Outcome It Targets
| Objective | What to measure | Common mistake |
|---|---|---|
| Household liquidity | Cash received and timing | Calling a restricted account immediate cash |
| Child poverty | After-tax resources and hardship | Treating poverty evidence as fertility evidence |
| Parental employment | Leave, hours, return to work and care supply | Ignoring provider capacity |
| Birth timing | Conceptions and period births by age or order | Claiming completed-fertility change too soon |
| Completed fertility | Lifetime births for completed cohorts | Using one-year TFR as the endpoint |
Interactive U.S. Family Policy Cost Calculator
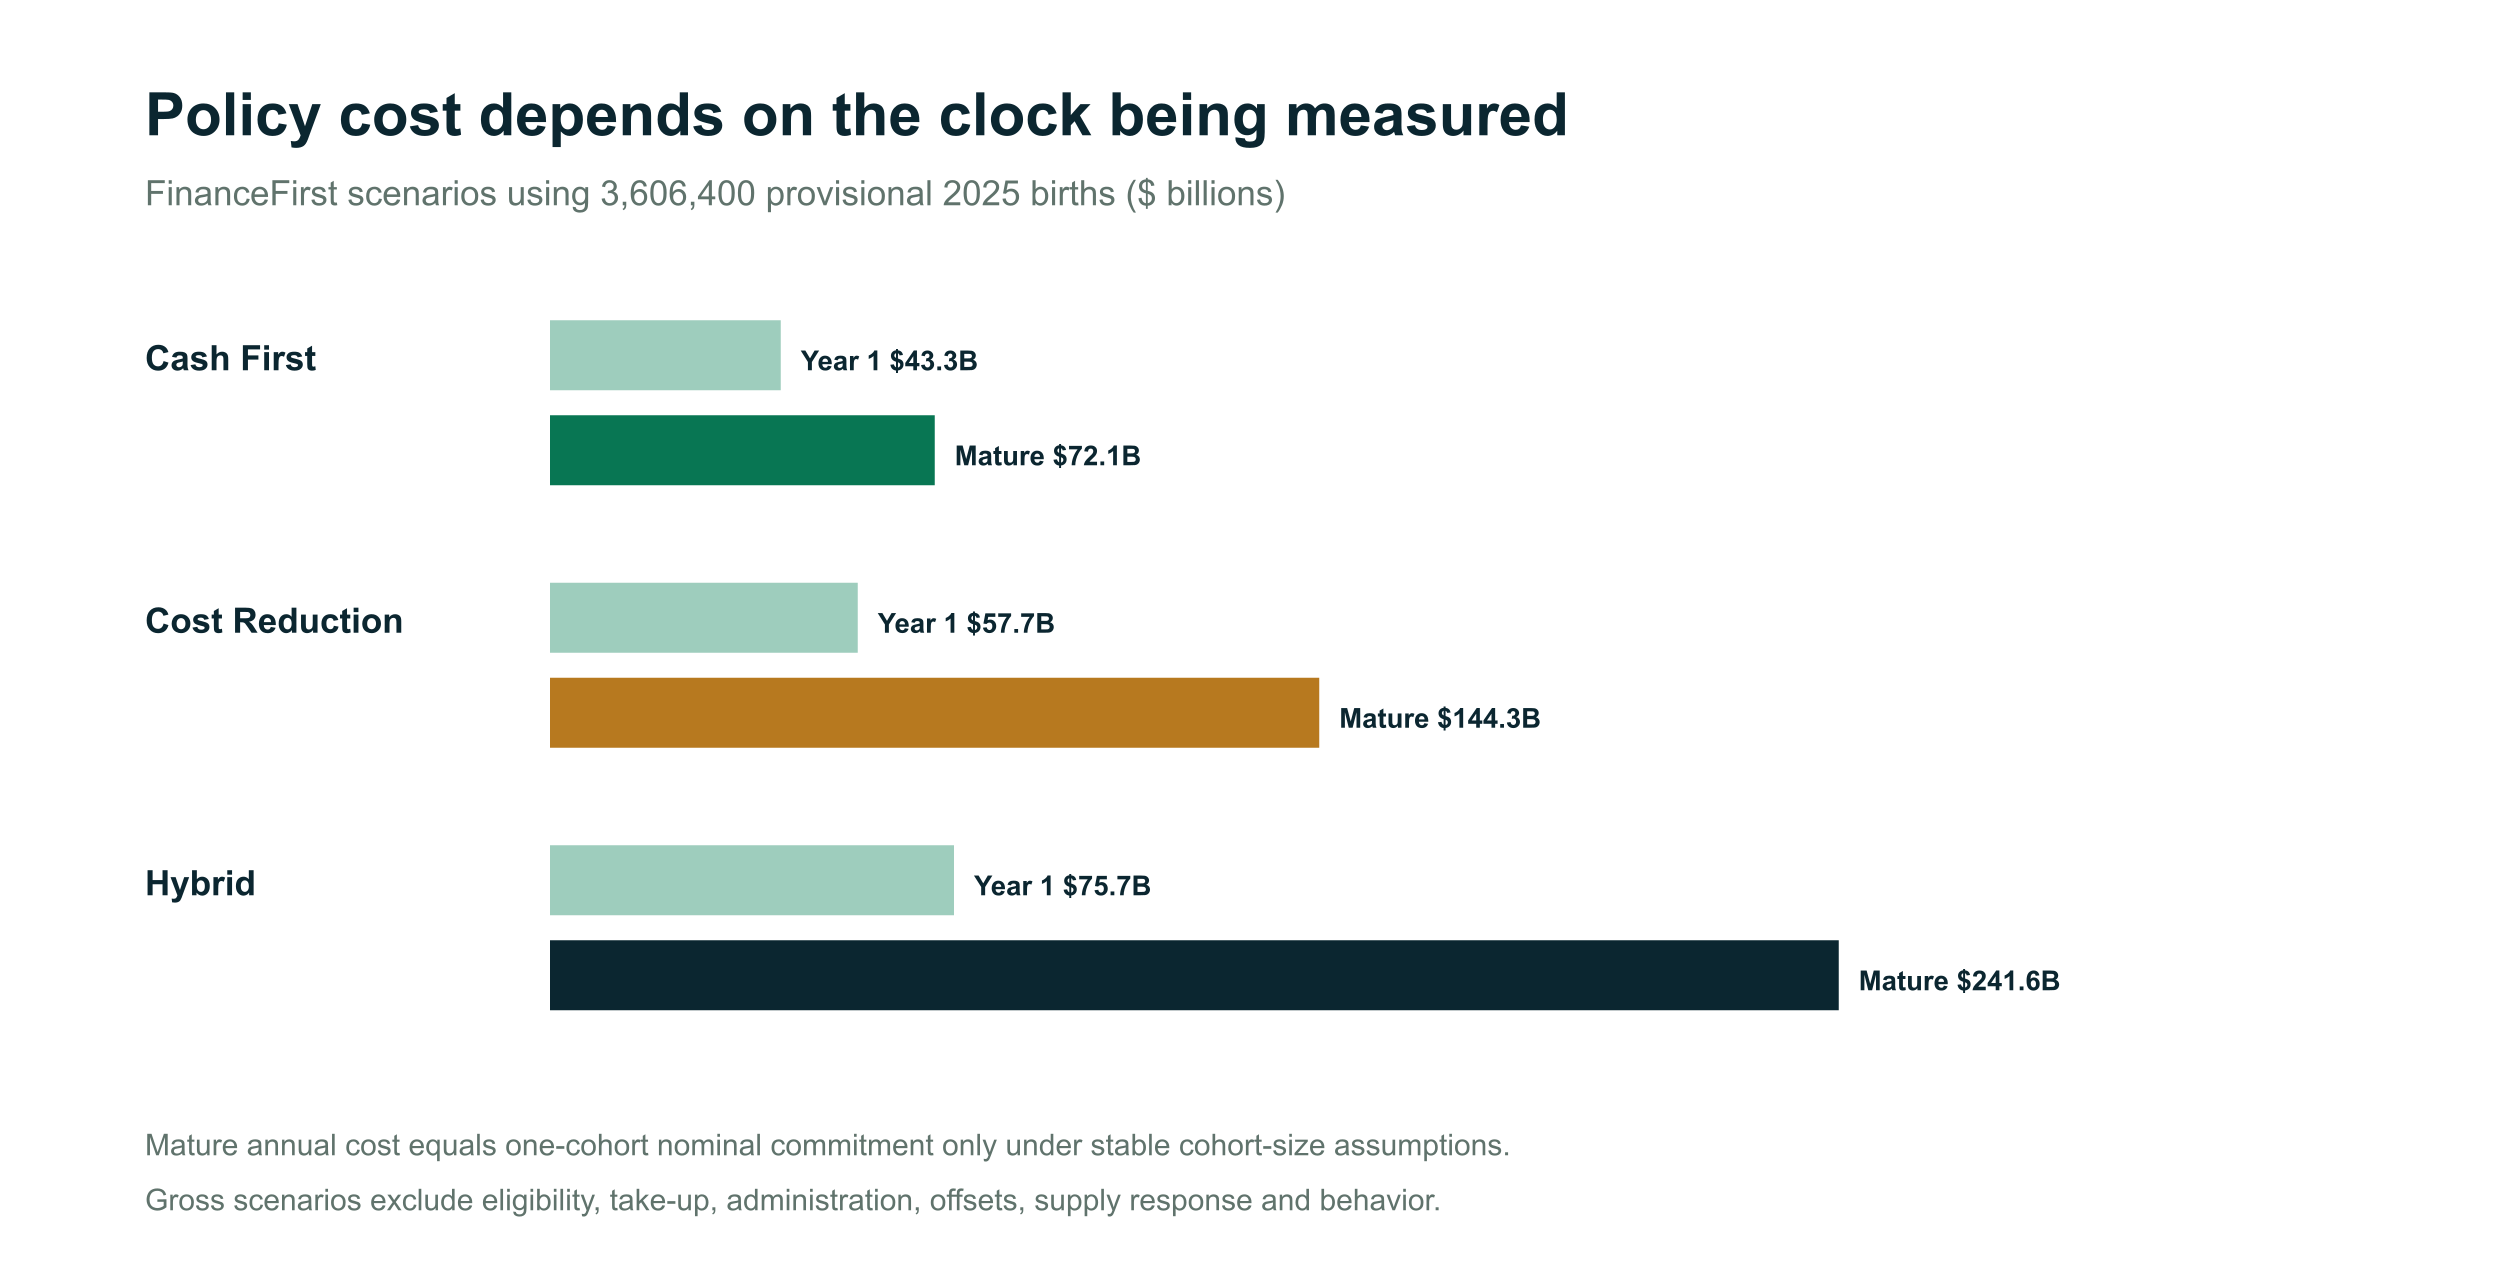
The calculator separates first-year cash cost, mature annual cash cost, one-cohort nominal commitment and present value. Defaults are illustrative and not an enacted program, forecast or legislative score.
| Annual births | 3,606,400 | Nominal per child | $42,000 |
|---|---|---|---|
| Birth payment | $10,000 | First-year gross | $43.277B |
| Annual credit | $2,000 for 16 years | Cohort commitment | $151.469B |
| Discount rate | 3% | Cohort present value | $126.665B |
Interactive scenario tool
Build a U.S. family-support package
Keep the gross-universal baseline visible, then optionally test eligibility, take-up, administration and indexation. This is transparent scenario arithmetic, not a budget score or fertility forecast.
Universal gross baseline
- Nominal per child
- $42,000
- First year
- $43.3B
- Mature annual
- $151.5B
- One cohort commitment
- $151.5B
- PV per child
- $35,122
- PV of one cohort
- $126.7B
- Share of budget
- 2.05%
- Births assumed
- 3,606,400
Optional participation scenario
- Participating births
- 3,606,400
- Indexed nominal per eligible child
- $42,000
- First-year cash cost
- $43.3B
- Mature annual cash cost
- $151.5B
- One-cohort nominal commitment
- $151.5B
- One-cohort present value
- $126.7B
What Would Illustrative U.S. Benefits Cost?
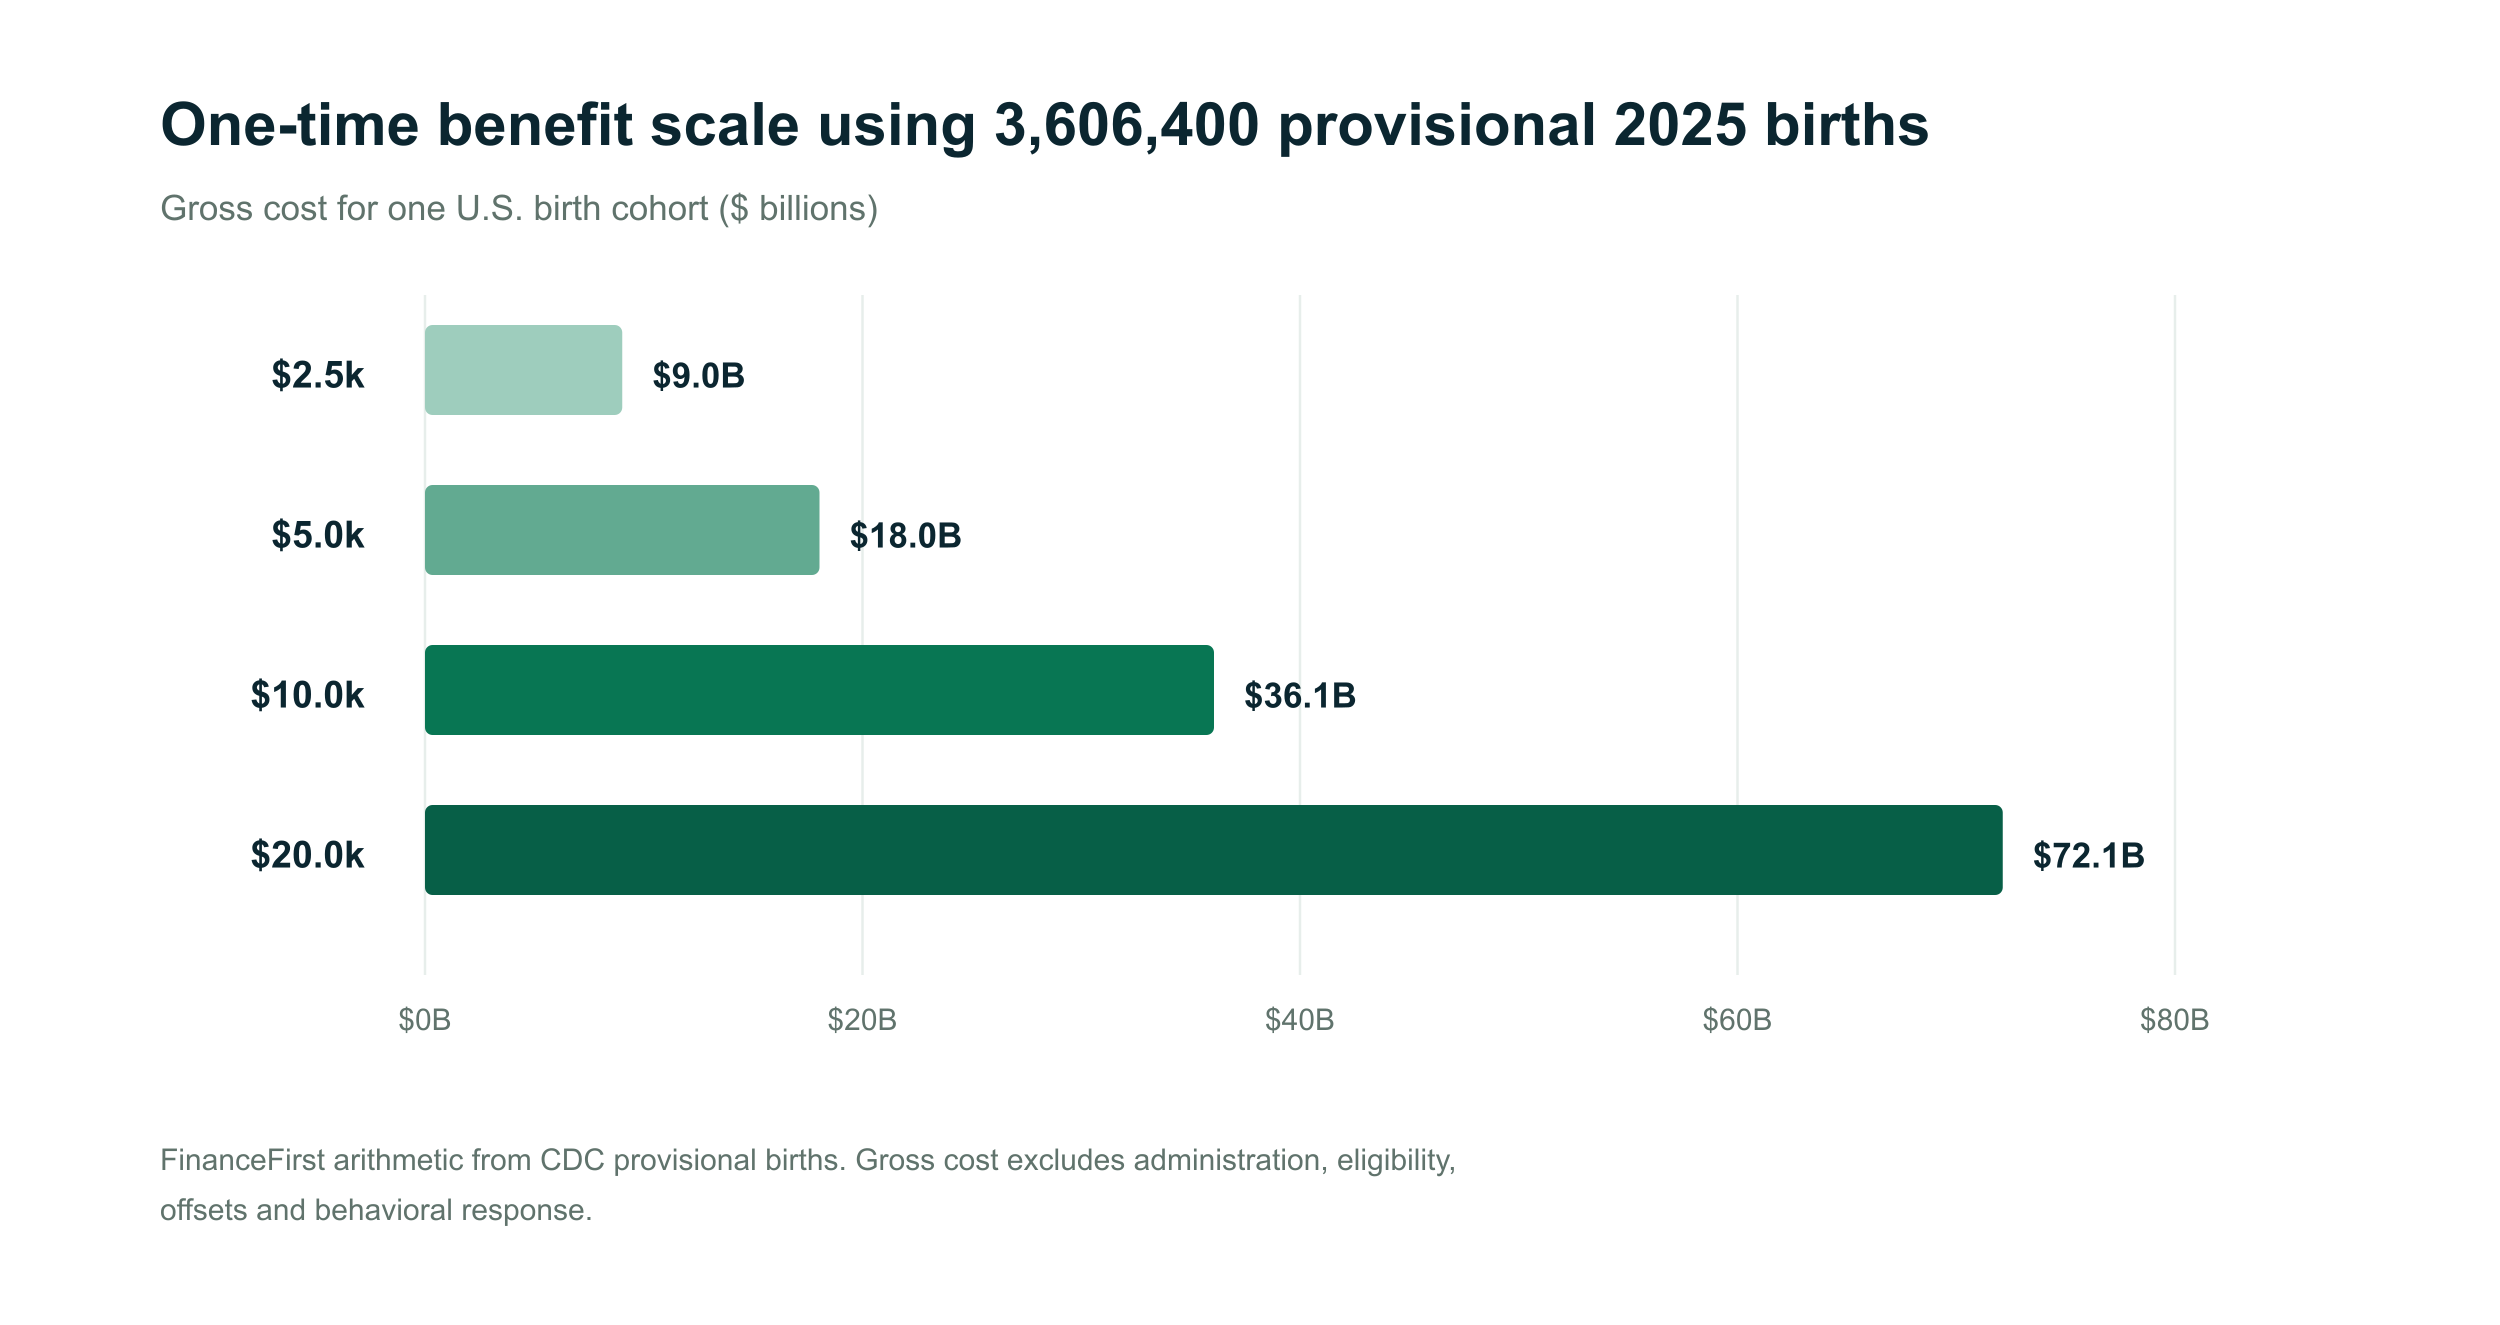
Using 3,606,400 provisional 2025 births, a universal one-time payment would cost $9.016 billion at $2,500 per birth, $18.032 billion at $5,000, $36.064 billion at $10,000 and $72.128 billion at $20,000. These are gross multiplications, not net budget estimates. [4]
What Cash, Leave, Care and Housing Evidence Can Support
Quasi-experimental studies find selected fertility-timing or birth-order responses to cash in Quebec and Spain, and a second-birth response to leave duration in Austria. A U.S. family-cap study found no measurable aggregate reduction. California leave and Quebec child care studies provide useful labor-market evidence without proving completed-fertility effects. [20] [21] [22] [23] [24] [26]
International Evidence Is a Stress Test, Not a U.S. Forecast
OECD evidence shows that cash, leave, early-childhood care and housing policies operate as systems. Cash-alone fertility effects are often modest or temporary, while care and leave can reduce work-family conflict. Countries with extensive support can remain far below replacement fertility. [30]
Quebec, Spain, Austria, Poland, South Korea and Hungary provide different lessons because benefit design, labor markets, housing, norms and baseline institutions differ. Simple before-and-after national TFR comparisons are not treated as causal.
Singapore's 2026 Package: Useful Design, Unknown Fertility Effect
Singapore''s resident TFR fell from 0.97 in 2024 to 0.87 in 2025. It recorded 30,004 live births in 2025, including 27,529 resident births. The new family package was announced in August 2026, so no demographic effect is yet observable. [3] [41]
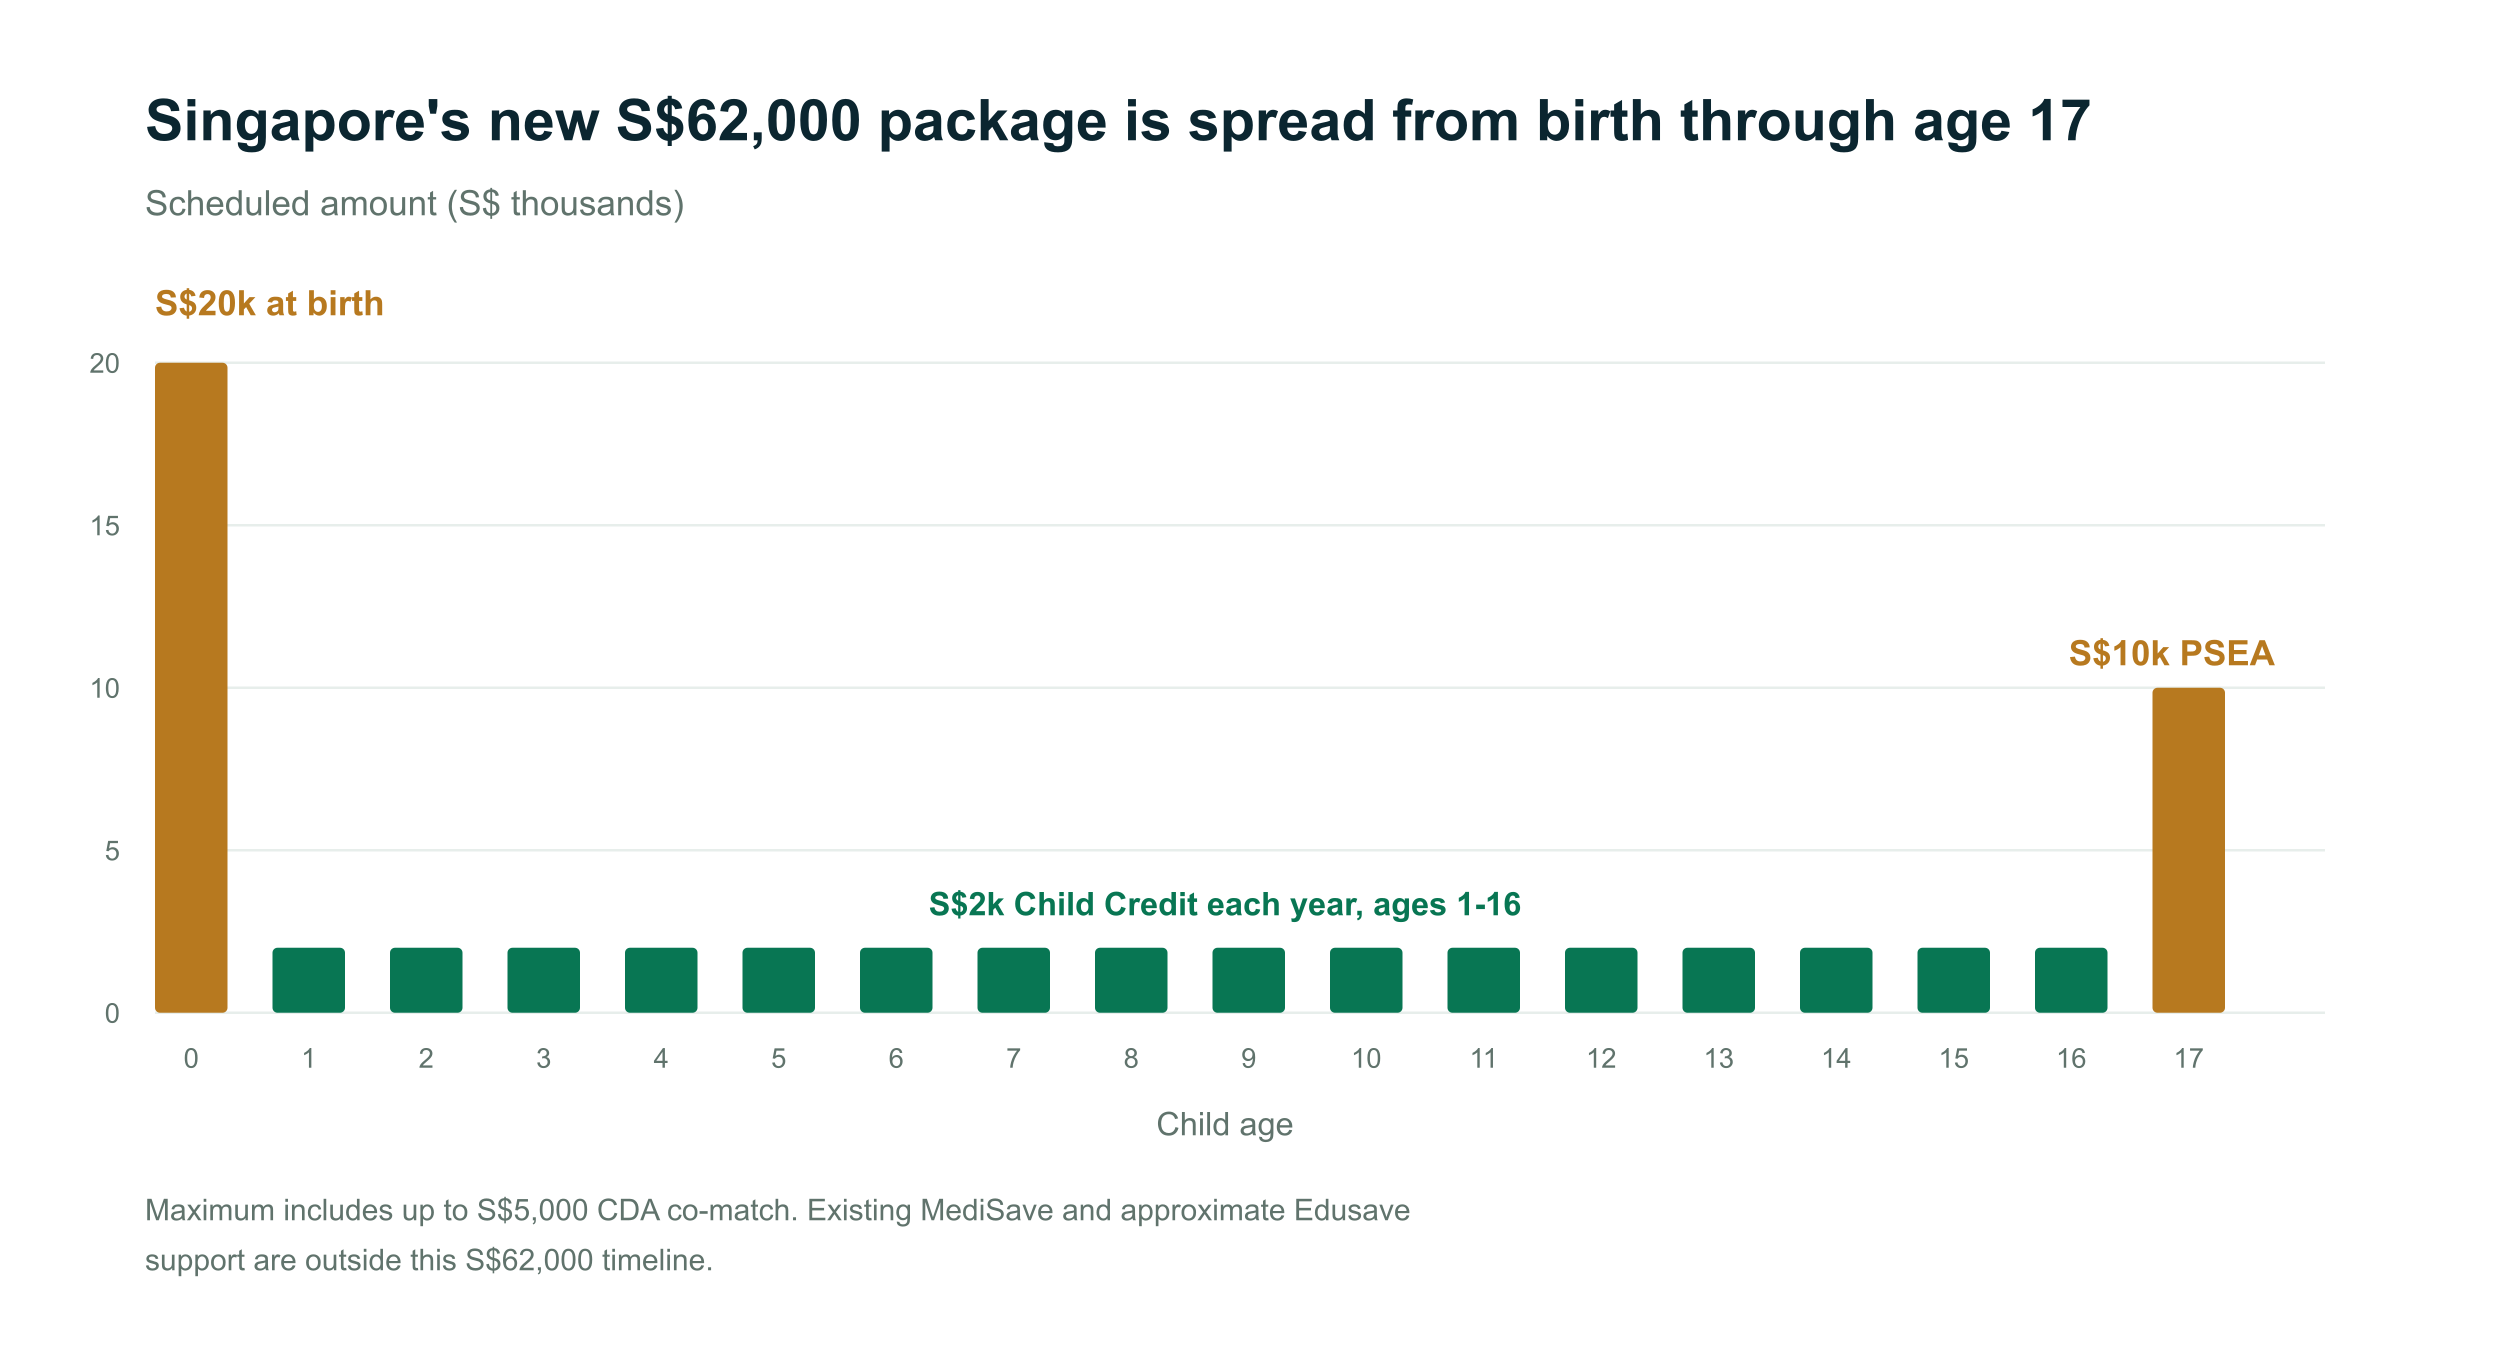
The package is worth up to S$62,000 from birth through age 17: S$10,000 Baby Gift, S$32,000 in annual Child Credits, a S$5,000 CDA grant, up to S$5,000 in matching deposits and a S$10,000 education-account top-up. Existing and approximate support brings the official broader description to almost S$70,000. It is not cash at birth. [1] [2]
Low Fertility Matters on a Long Fiscal and Workforce Clock
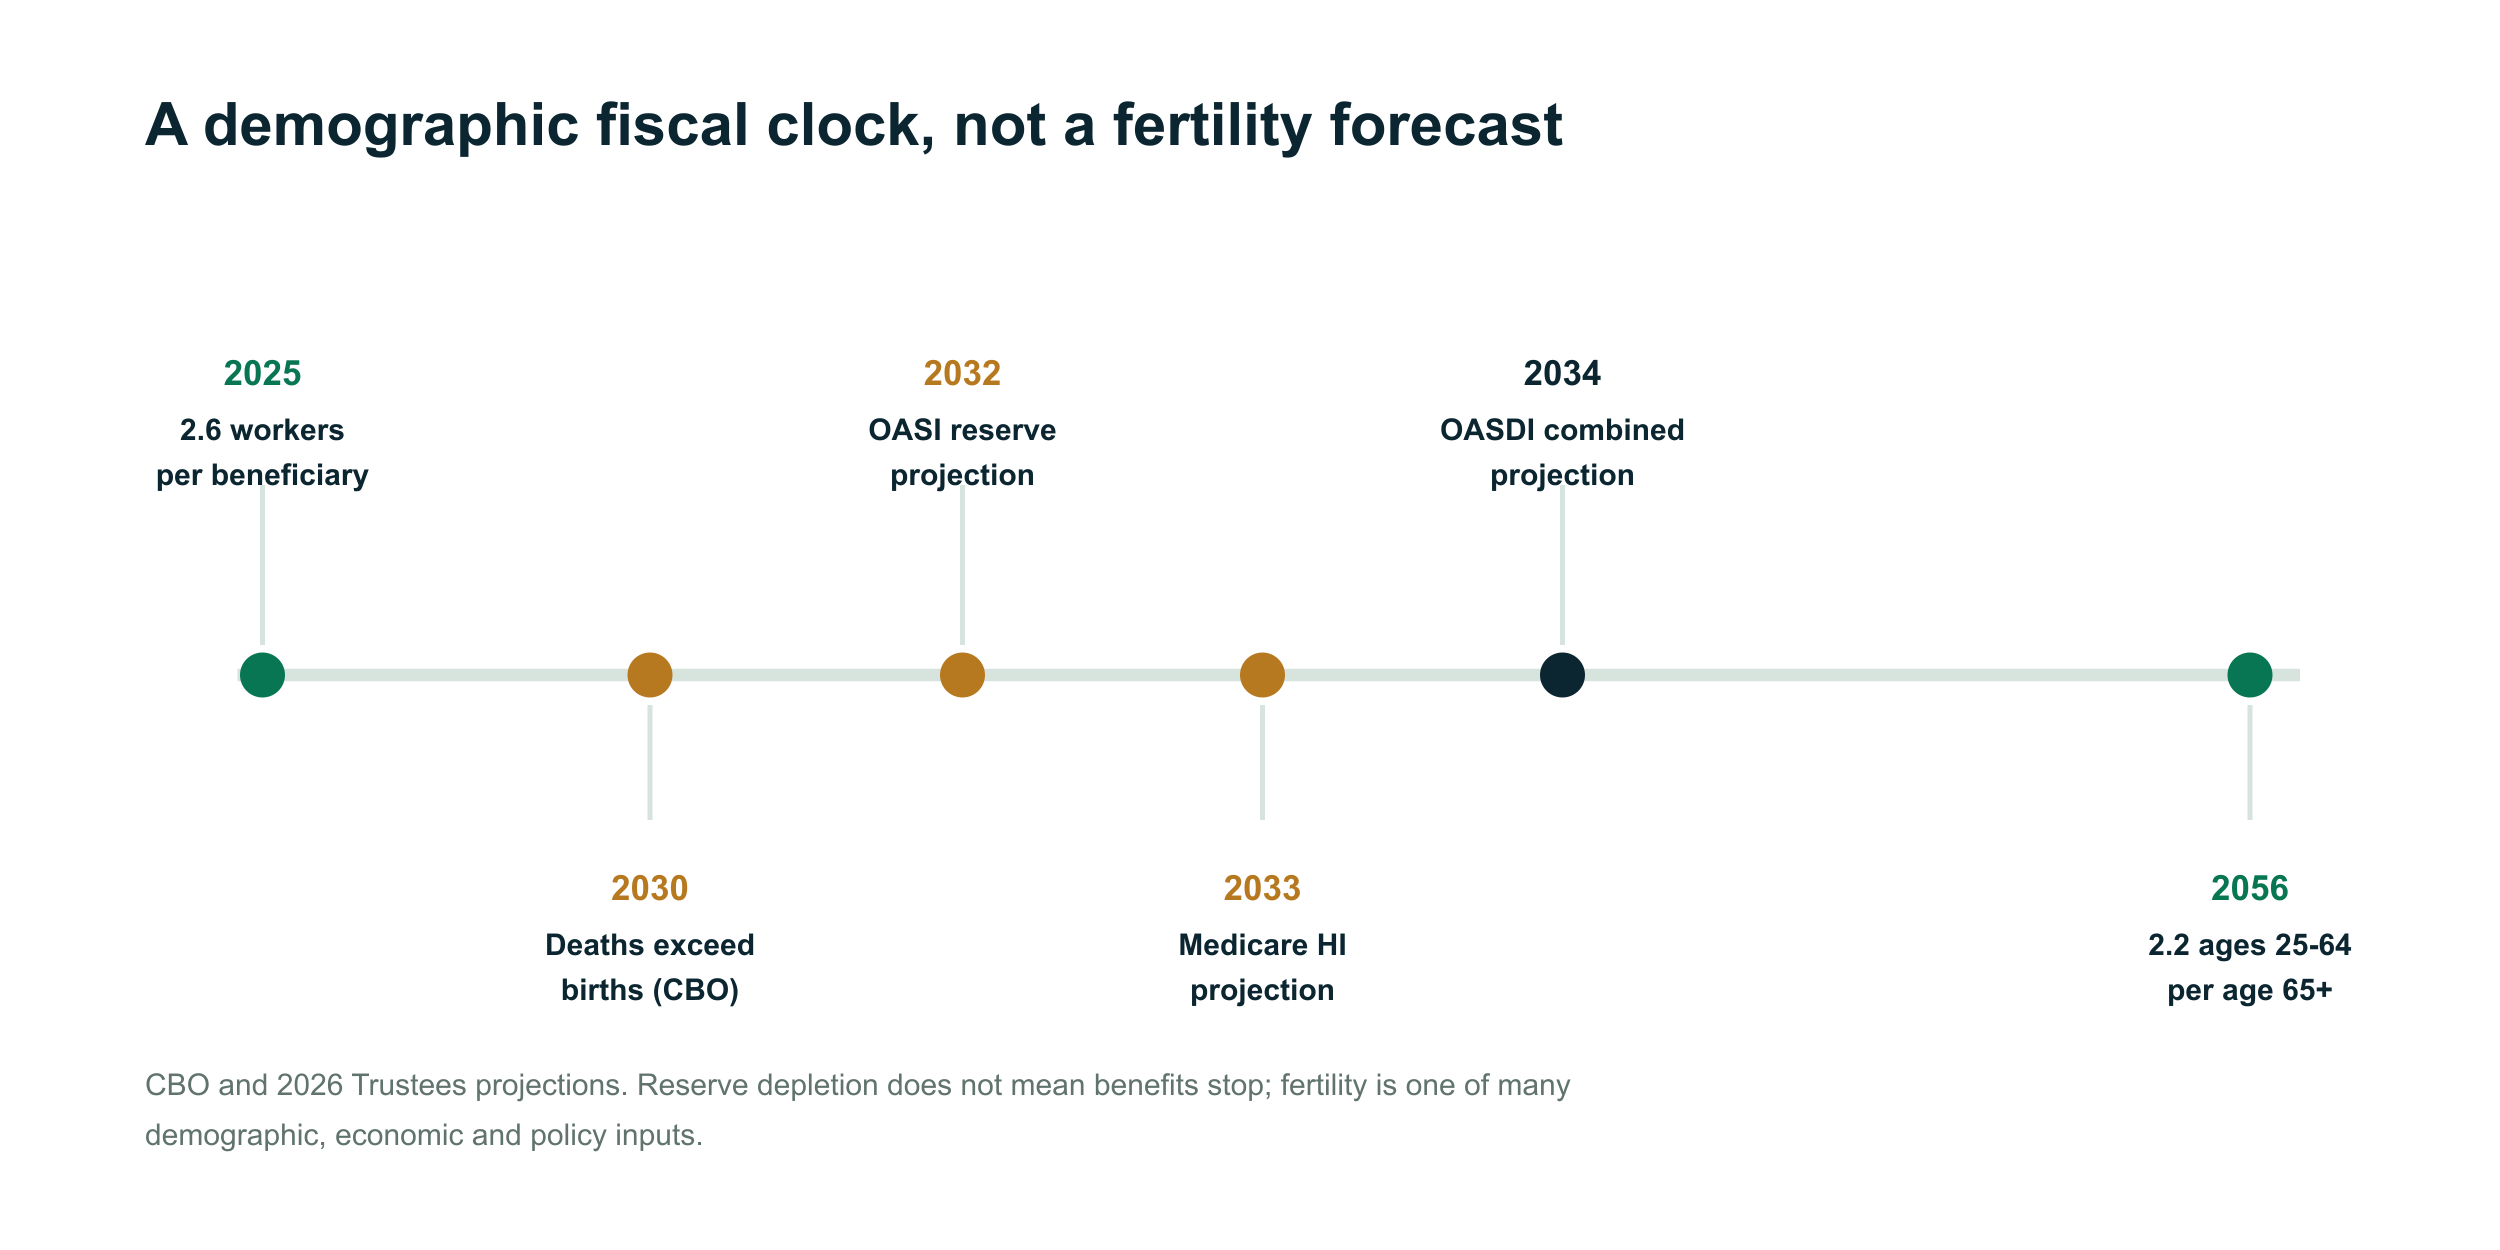
CBO projects the population grows from 349 million in 2026 to 364 million in 2056, then reaches zero growth. It projects deaths exceed births beginning in 2030, after which net immigration accounts for all population growth. The number of people ages 25-64 per person age 65 or older falls from 2.7 to 2.2. [12]
CBO projects the TFR at 1.58 in 2026 and 1.53 from 2036 onward. Those are assumptions in a projection, not targets or certainties. Population, total GDP and GDP per person are different outcomes. Productivity, participation, wages, capital and distribution also matter.
Social Security: Fertility Changes the Long Run, Not the 2030s
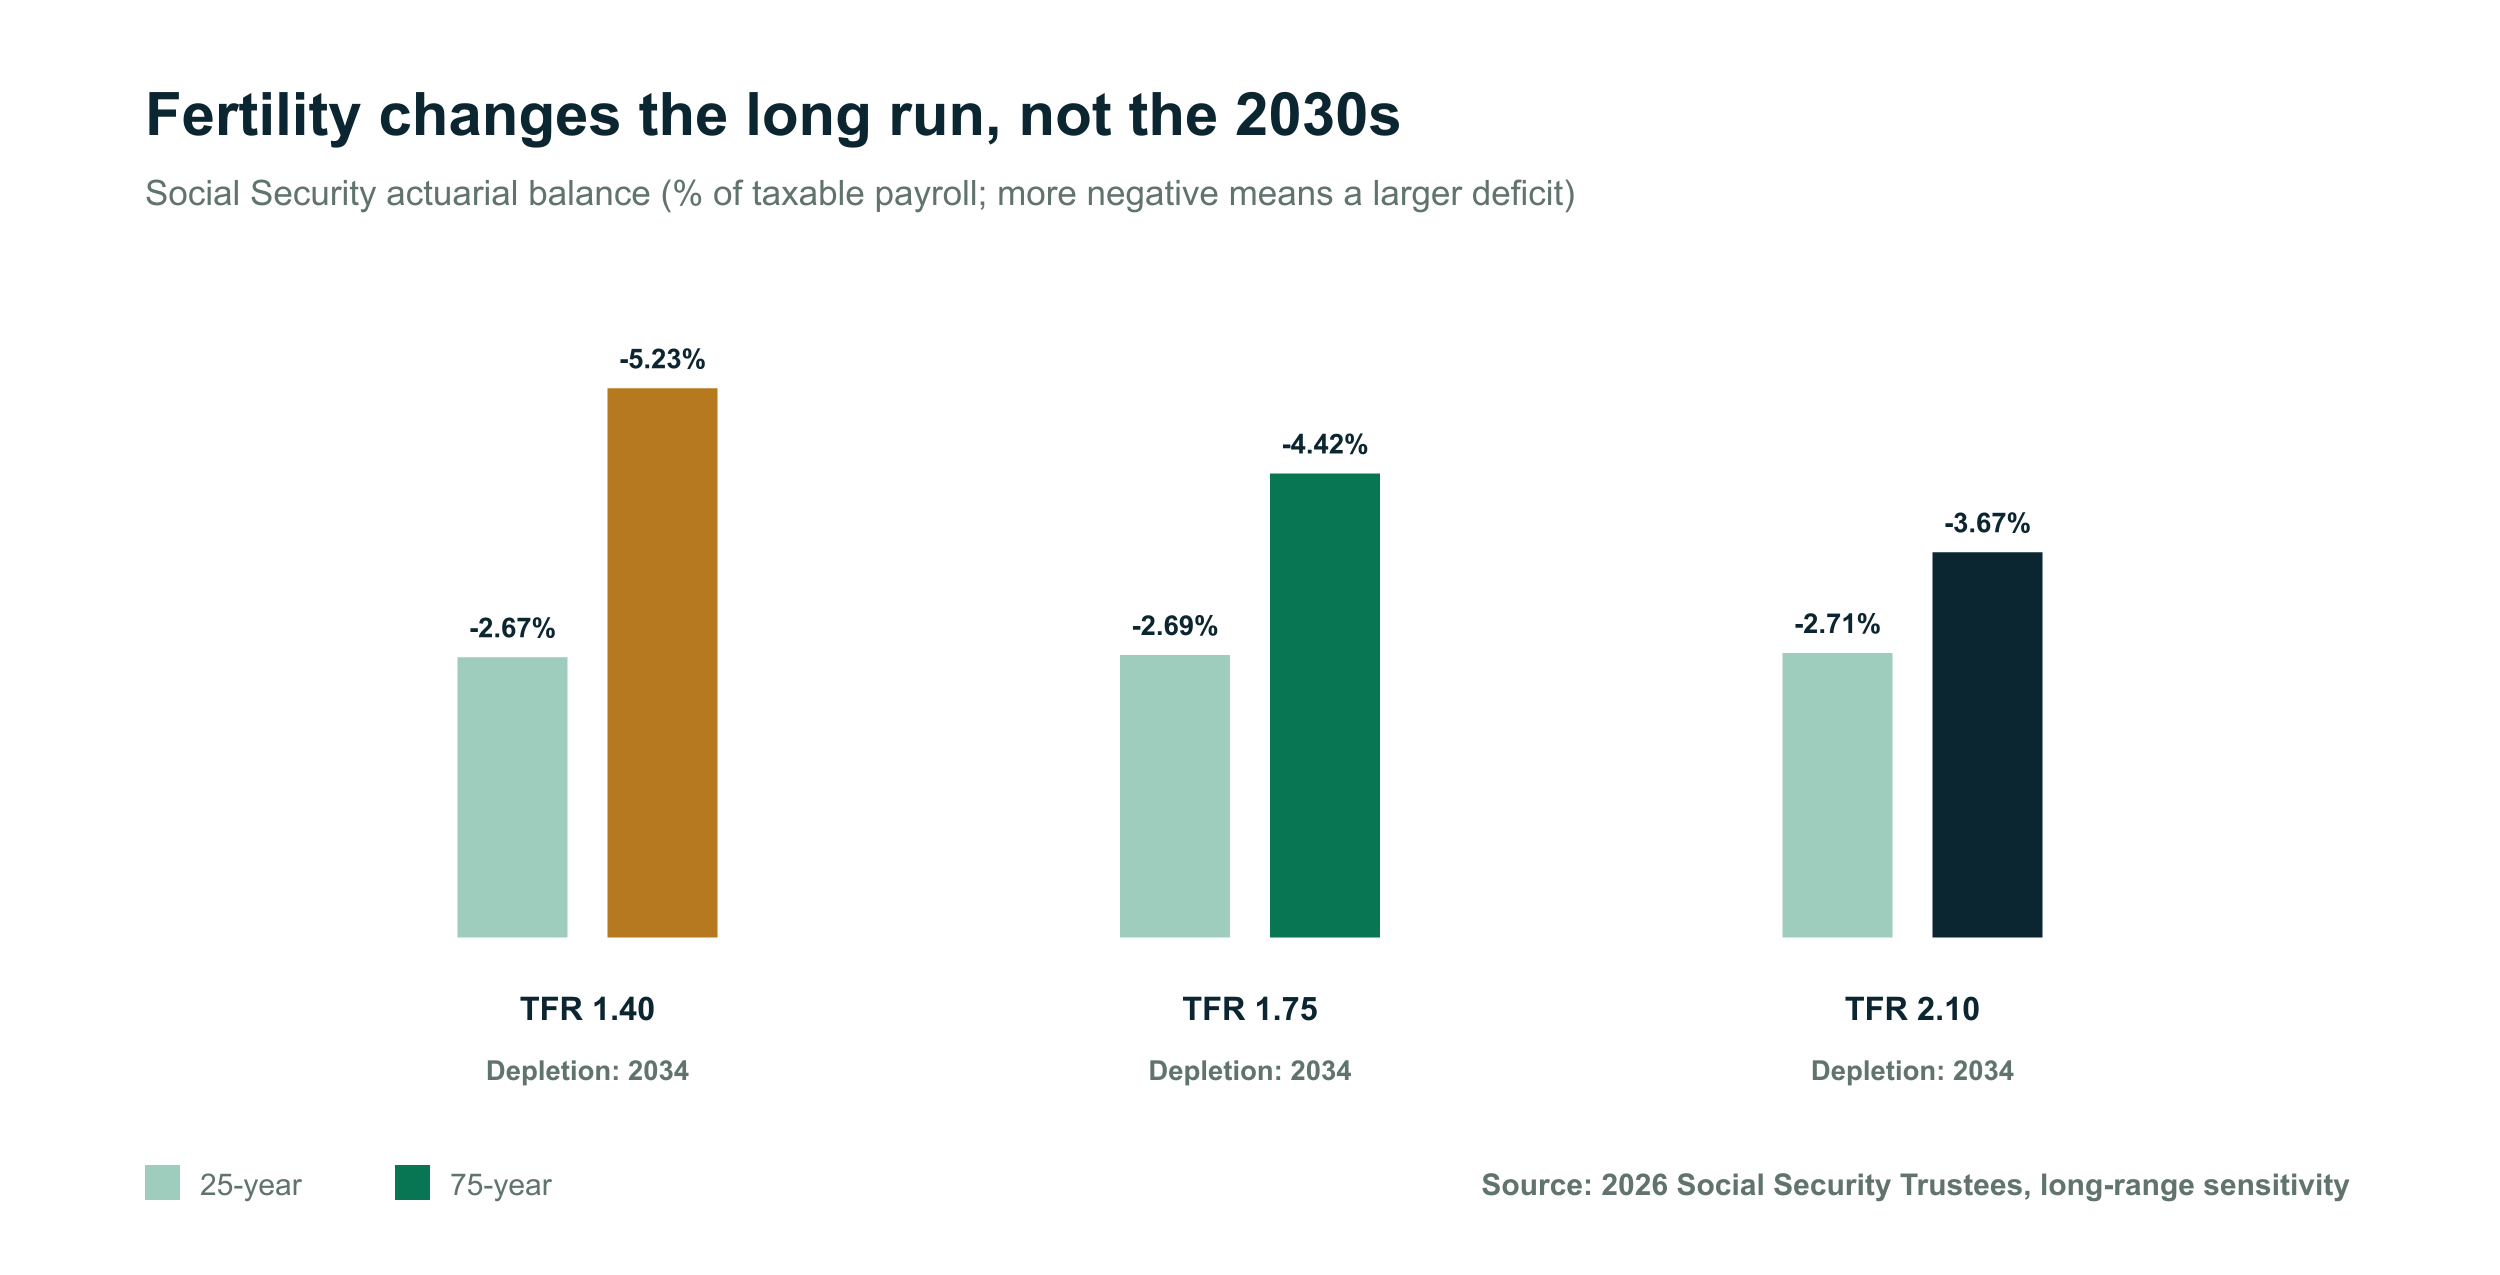
The 2026 Trustees test ultimate TFR assumptions of 1.40, 1.75 and 2.10. The 75-year actuarial balance improves from -5.23% to -4.42% to -3.67% of taxable payroll, yet the combined reserve-depletion year remains 2034 in all three cases. Each 0.1 increase in ultimate TFR improves the long-range balance by about 0.22% of taxable payroll. [31]
Immigration, Participation and Productivity Work on Different Clocks
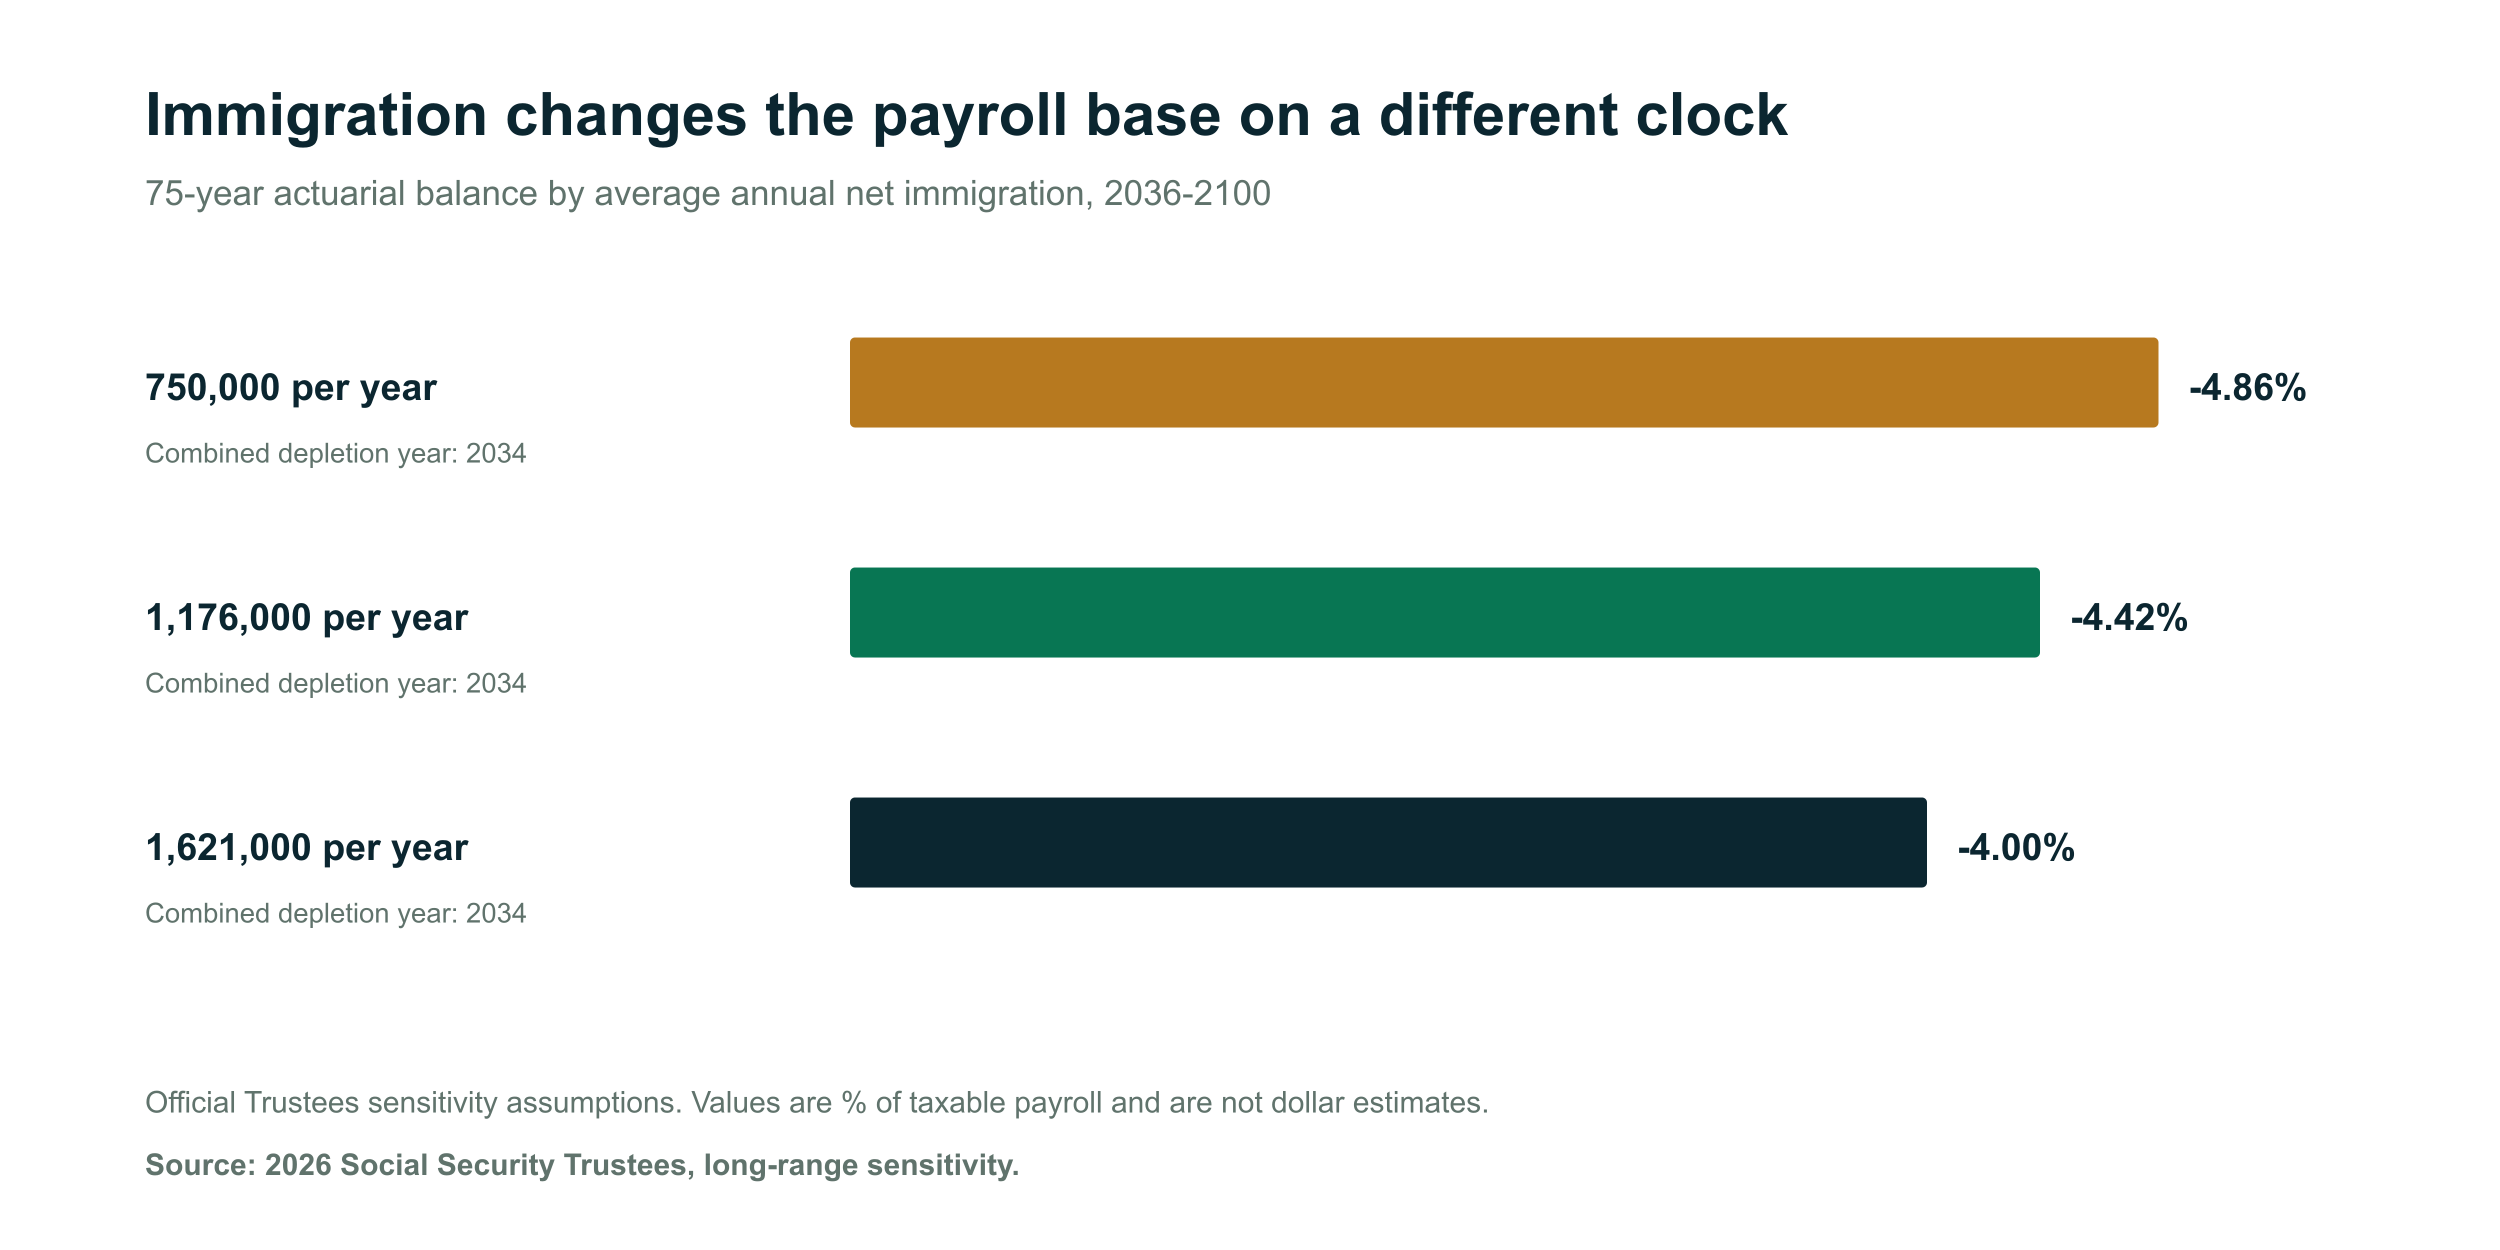
The Trustees'' average annual net-immigration assumptions of 750,000, 1,176,000 and 1,621,000 produce 75-year balances of -4.86%, -4.42% and -4.00% of taxable payroll, while combined depletion remains 2034. Immigration can add workers sooner than newborns, depending on age, employment and earnings. [31]
Medicare Is an Aging and Health-Cost Story
The 2026 Medicare Trustees project Hospital Insurance reserve depletion in the second quarter of 2033, with 89% of scheduled HI costs payable in the depletion year and 93% in 2100. The HI actuarial balance is -0.56% of taxable payroll. Part B and Part D are financed differently through annually reset premiums and general revenues. [40]
Fertility is only one demographic input. Health-cost growth, wages, provider payments, labor participation, immigration and future policy choices all affect the result. CBO projects combined Social Security and Medicare outlays rise from 8.7% of GDP in 2027 to 10.1% in 2036. [34]
What We Still Do Not Know
- How much of the national decline reflects births delayed versus permanently forgone.
- How preferences, partnership, health, direct cost and opportunity cost interact for the same person.
- Which policy package would change completed U.S. fertility, by how much and for whom.
- How quickly child care or housing supply would respond to a national subsidy.
- What Singapore''s 2026 package will do; it is too new for outcome evaluation.
- Whether a single state''s one-year GFR change reflects behavior, composition, migration or reporting variation.
Uncertainty is not a reason to ignore household hardship. It is a reason to match each claim to the outcome actually measured.
Journalist and Researcher Resources
Every downloadable asset uses the canonical report name and version 2.0. The package includes machine-readable national trends, state data, policy scenarios, study limits, fiscal sensitivities, charts, a workbook, checksums and methodology.
- Full report PDF
- Methodology PDF
- Editable research workbook
- Publication JSON
- Data, code, manifests and source ledger package
- Chart pack
Suggested citation: Asim Ahmad. “America''s Falling Birth Rate: U.S. Fertility & Family Affordability Report 2026.” FinanceFirst Research, version 2.0, September 2, 2026.
Questions and correction notices: info@financefirst.co. See the corrections policy.
Methodology, Reproducibility and Citation Rules
National fertility series come from CDC; childlessness from Census; childcare prices from DOL; inflation context from BLS; income and rent from ACS; policy evidence from primary government, peer-reviewed studies and identified working papers; projections from CBO, SSA and CMS.
The state dashboard does not impute missing observed prices or create a composite rank. National CPI translations are separately labeled context. Policy costs are gross arithmetic. Spot exchange rates are not purchasing-power parity. Projections remain attributed. Working papers remain labeled. No external endorsement or approval is claimed.
Download the full methodology and data dictionary or review the claim-to-source audit.
Technical methods and validation
Version 2.0: U.S.-first editorial structure, CDC national fertility and birth-order series, Census childlessness, delayed-parenthood analysis, BLS child care CPI context, study registry, 50-state dashboard, policy-cost models, and exact CBO, SSA and CMS projection values.
Claim classes remain separate. Period fertility does not equal completed fertility. Historical state prices remain observed historical values; CPI translations are context only. No composite score, fertility forecast, legislative score or claim of external approval is made.
Sources and data references
Sources are listed for transparency. Data periods may differ, so each chart and claim should be read with its cited date and methodology.
- Singapore Prime Minister's Office - National Day Rally 2026
Official August 23, 2026 speech summary covering direct support, child care, housing and policy context.
Accessed September 1, 2026
- Singapore Strategy Group - Marriage and Parenthood Measures at National Day Rally 2026
Official component amounts, ages, start dates, transition rules and the distinction between up to S$62,000 in new measures and almost S$70,000 in total support.
Accessed September 1, 2026
- Singapore Department of Statistics - Births and Fertility Table Builder
Official table for Singapore live births and resident total fertility rate.
Accessed September 2, 2026
- CDC NCHS - Provisional Births: 2025
Provisional 2025 U.S. births and general fertility rate, including coverage and revision status.
Accessed September 1, 2026
- CDC NCHS - Births: Final Data for 2024
Final 2024 births, GFR, TFR, first-birth age and live-birth order.
Accessed September 2, 2026
- CDC NCHS - State Fertility Rate, 2024
Final 2024 state births and general fertility rates from NVSS via CDC WONDER.
Accessed September 1, 2026
- U.S. Department of Labor - National Database of Childcare Prices
Official county and state child care price estimates for 2008-2022.
Accessed September 1, 2026
- U.S. Department of Labor - NDCP Technical Report
Definitions, source construction, modeling details and limitations for the childcare-price data.
Accessed September 1, 2026
- U.S. Census Bureau - 2024 ACS One-Year Summary File
State median household income and median gross rent from tables B19013 and B25064.
Accessed September 1, 2026
- U.S. Department of Labor Women's Bureau - Paid Leave
Current federal inventory of state paid family and medical leave laws.
Accessed September 1, 2026
- Federal Reserve Board via FRED - DEXSIUS
H.10 Singapore dollars per U.S. dollar spot exchange rate; 1.2744 on August 28, 2026.
Accessed September 1, 2026
- Congressional Budget Office - The Demographic Outlook: 2026 to 2056
Population growth, births and deaths, net immigration and age-support projections.
Accessed September 1, 2026
- Social Security Administration - 2026 Trustees Report Projection Table
Covered workers per OASDI beneficiary and long-range intermediate projections.
Accessed September 1, 2026
- Social Security and Medicare Boards of Trustees - 2026 Summary
OASI, OASDI and Medicare HI reserve depletion projections and payable shares.
Accessed September 1, 2026
- Congressional Budget Office - 2026 Budget and Economic Data
FY2026 federal outlay projection used only as a scale denominator.
Accessed September 1, 2026
- U.S. Census Bureau - Impact of the 2021 Expanded Child Tax Credit on Child Poverty
Census estimate of the temporary expansion's Supplemental Poverty Measure effect.
Accessed September 1, 2026
- Internal Revenue Service - Internal Revenue Bulletin 2025-45
Official 2026 Child Tax Credit maximum and refundable amount; eligibility rules apply.
Accessed September 1, 2026
- CDC NCHS - Birth Expectations in the United States, 2022-2023
NSFG expected future births by age and prior births. Expectations are not completed fertility.
Accessed September 1, 2026
- Gallup - Americans' Ideal Family Size Remains Above Two Children
Transparent 2025 survey of ideal family size. An attitude question is not a fertility outcome.
Accessed September 1, 2026
- Milligan - Subsidizing the Stork
Quebec cash incentive study, later published in the Review of Economics and Statistics.
Accessed September 1, 2026
- Gonzalez - Universal Child Benefit, Conceptions, Abortions and Maternal Labor Supply
Peer-reviewed Spain policy study with fertility and early labor-supply outcomes.
Accessed September 1, 2026
- Lalive and Zweimuller - Parental Leave, Fertility and Return to Work
Peer-reviewed Austrian policy-discontinuity evidence on second births, spacing and return to work.
Accessed September 1, 2026
- Kearney - Incremental Welfare Benefits and Fertility Behavior
U.S. state family-cap study reporting no measurable aggregate fertility reduction.
Accessed September 1, 2026
- Baker, Gruber and Milligan - Long-Run Impacts of a Universal Child Care Program
2026 working paper on Quebec maternal employment, earnings and fiscal flows; not a direct fertility estimate.
Accessed September 1, 2026
- Dettling and Kearney - House Prices and Birth Rates
Historical U.S. evidence with different homeowner and nonowner channels.
Accessed September 1, 2026
- Bailey et al. - Long-Run Effects of California's Paid Family Leave Act
Quasi-experimental evidence on leave use and maternal labor-market outcomes; not completed fertility.
Accessed September 1, 2026
- Congressional Budget Office - The Long-Term Budget Outlook: 2026 to 2056
Long-term fiscal context and uncertainty across demographic, economic and policy inputs.
Accessed September 1, 2026
- Pew Research Center - The Experiences of U.S. Adults Who Don't Have Children
Reasons reported by a defined subgroup unlikely to have children; multiple responses allowed.
Accessed September 2, 2026
- Pew Research Center - Adults Without Children Methodology
Field dates, subgroup n=770 and plus or minus 5.3 percentage-point margin of error.
Accessed September 2, 2026
- OECD - Society at a Glance 2024
Cross-country fertility and family-policy synthesis.
Accessed September 2, 2026
- Social Security Administration - 2026 Long-Range Sensitivity Analysis
Official fertility and net-immigration actuarial sensitivities.
Accessed September 2, 2026
- CDC NCHS - Births: Final Data for 2023
Comparable final 2023 state GFRs.
Accessed September 2, 2026
- Kearney, Levine and Pardue - The Puzzle of Falling U.S. Birth Rates since the Great Recession
Peer-reviewed review of candidate explanations.
Accessed September 2, 2026
- Congressional Budget Office - The Budget and Economic Outlook: 2026 to 2036
Current fiscal, population and aging context.
Accessed September 2, 2026
- CDC NCHS - Effects of Age-specific Fertility Trends on Overall Fertility Trends, 1990-2023
Long-run GFR, TFR and maternal-age shifts.
Accessed September 2, 2026
- U.S. Census Bureau - Fertility of Women in the United States: 2024
Age-specific childlessness and fertility tables.
Accessed September 2, 2026
- Kearney and Levine - Why Is Fertility So Low in High-Income Countries?
Peer-reviewed 2026 literature synthesis.
Accessed September 2, 2026
- Federal Reserve Bank of Atlanta - What's Behind Declining Birth Rates in the U.S.?
2026 working paper on cohort parity, desire and impaired fecundity; not peer reviewed.
Accessed September 2, 2026
- U.S. Bureau of Labor Statistics - CPI-U Day Care and Preschool
National price-index context through July 2026.
Accessed September 2, 2026
- Centers for Medicare & Medicaid Services - 2026 Medicare Trustees Report
HI depletion, payable shares and SMI financing context.
Accessed September 2, 2026
- Singapore Department of Statistics - Births and Fertility Rates Data API
Official API for the latest resident TFR and birth counts.
Accessed September 2, 2026
- U.S. Census Bureau - While Share of Younger Women Without Children Increased
Age-specific childlessness and delay versus later completed childbearing.
Accessed September 2, 2026
Frequently asked questions about this report
What is the latest U.S. fertility rate?
CDC reported a final 2024 total fertility rate of 1.5995 births per woman and a final general fertility rate of 53.8 births per 1,000 women ages 15-44. The provisional 2025 general fertility rate was 53.1. These are period measures, not completed family size.
Why is the U.S. birth rate falling?
No single cause has been established. Preferences, delayed family formation, partnership, direct and opportunity costs, service availability, health and uncertainty overlap.
Is delayed parenthood the same as permanent childlessness?
No. A later first birth can lower current period fertility even if it occurs later. Childlessness at younger ages is not permanent childlessness.
Do child care costs explain falling fertility?
Child care is a major household cost, but state prices, income and fertility do not establish causation. National CPI context cannot produce current state quotes.
Do cash benefits increase fertility?
Some studies find timing or birth-order responses in specific settings. The evidence does not support one universal U.S. effect. Cash can still improve liquidity or reduce poverty.
Can higher fertility fix Social Security soon?
No. In the 2026 Trustees sensitivity, all tested fertility assumptions retain a 2034 combined depletion year. Higher fertility matters more over the long run.
What does Singapore teach the United States?
Its design shows why timing, restrictions, service capacity and housing matter. Its 2026 fertility effect is unknown, and its resident TFR is not perfectly comparable with the U.S. national measure.
Can I use the state CPI-context value as a 2026 quote?
No. It is an index translation using national BLS inflation, not a current observed state market price or provider quote.
How to cite this report
Asim Ahmad. “America's Falling Birth Rate: U.S. Fertility & Family Affordability Report 2026.” FinanceFirst Research, version 2.0, September 1, 2026. https://financefirst.co/reports/us-fertility-family-affordability-2026
About the author
Asim Ahmad
Founder and Editor
Asim Ahmad is the founder and editor of FinanceFirst, where he leads editorial standards, consumer-finance research, and data-driven financial education.
Put the research to work
Related working calculators
50/30/20 Budget Calculator
Compare take-home income and actual spending with the flexible 50% needs, 30% wants and 20% savings or debt-payment rule of thumb.
Use calculator →Emergency Fund Calculator
Estimate an emergency-savings range from essential monthly expenses, income structure, job stability, current savings and monthly contributions.
Use calculator →Retirement Savings Calculator
Project retirement savings with monthly contributions and a constant-return scenario, then compare the result with a 4% first-year withdrawal planning target.
Use calculator →Continue with practical guidance
Related reading
Tax Moves for Every Life Change in 2026: Marriage, Baby, Home, Job Loss & More
Major life events change your tax situation overnight, but most people only find out at filing time, after they have already missed deductions and credits worth thousands. This is the playbook for the seven biggest life changes: exactly which forms to update, which credits to claim, and which deadlines you cannot miss.
Retirement Planning by Age in 2026: Savings Goals for Your 30s, 40s, 50s & 60s
Whether you are 25 or 55, this is the only retirement planning guide you will ever need. Covers exactly how much to save, where to invest, which accounts to use, Social Security optimization, healthcare planning, and the precise steps to retire on your terms. Backed by data from Fidelity, Vanguard, and the Federal Reserve.
Mortgage Rates in 2026: Forecasts, Trends & 9 Ways to Get the Best Rate
Mortgage rates have dropped nearly a full percentage point from their 2025 highs, with 30-year fixed rates now hovering near 6%. Whether you are buying your first home, upgrading, or refinancing, your mortgage rate determines how much you pay over the life of your loan. This complete guide covers current rates, expert forecasts, proven strategies to lock in the lowest rate possible, first-time buyer programs, and how to decide between fixed and adjustable rate mortgages.