
The U.S. labor market added 165,000 payroll jobs in October, and upward revisions lifted the recent hiring trend. Yet a closer look at pay and hours shows why a stronger employment headline may deliver only a small improvement in household income.
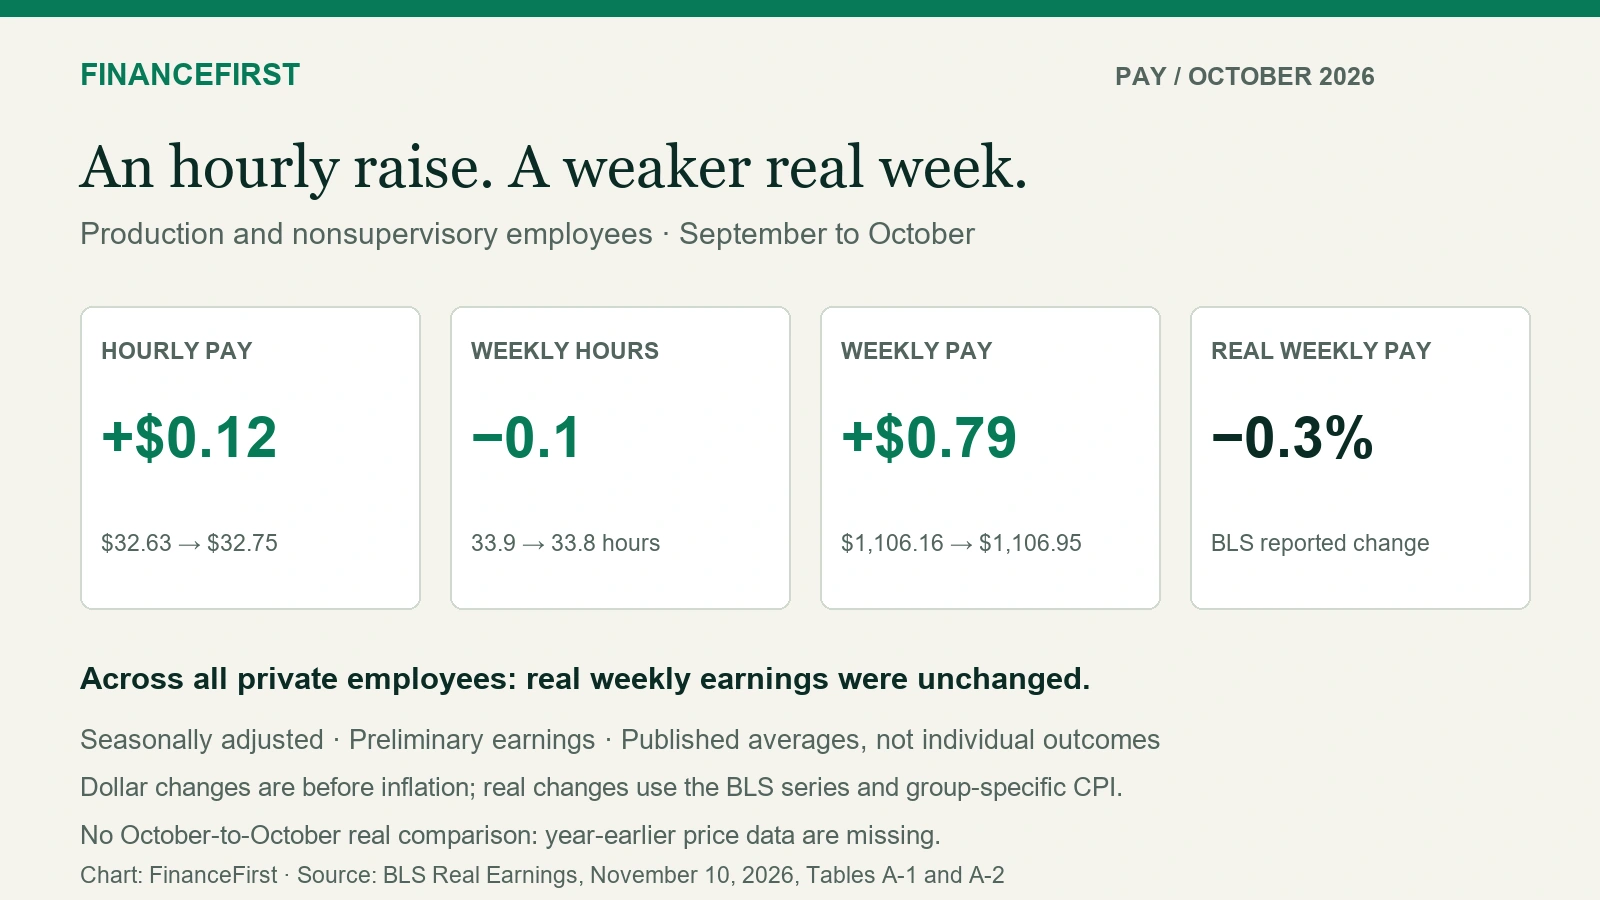
For production and nonsupervisory employees, average hourly earnings rose 12 cents to $32.75. Their average workweek shortened from 33.9 to 33.8 hours, leaving average weekly earnings just $0.79 higher, at $1,106.95. This group accounted for 81.6% of private payroll employment in the Bureau of Labor Statistics’ November 6 release.
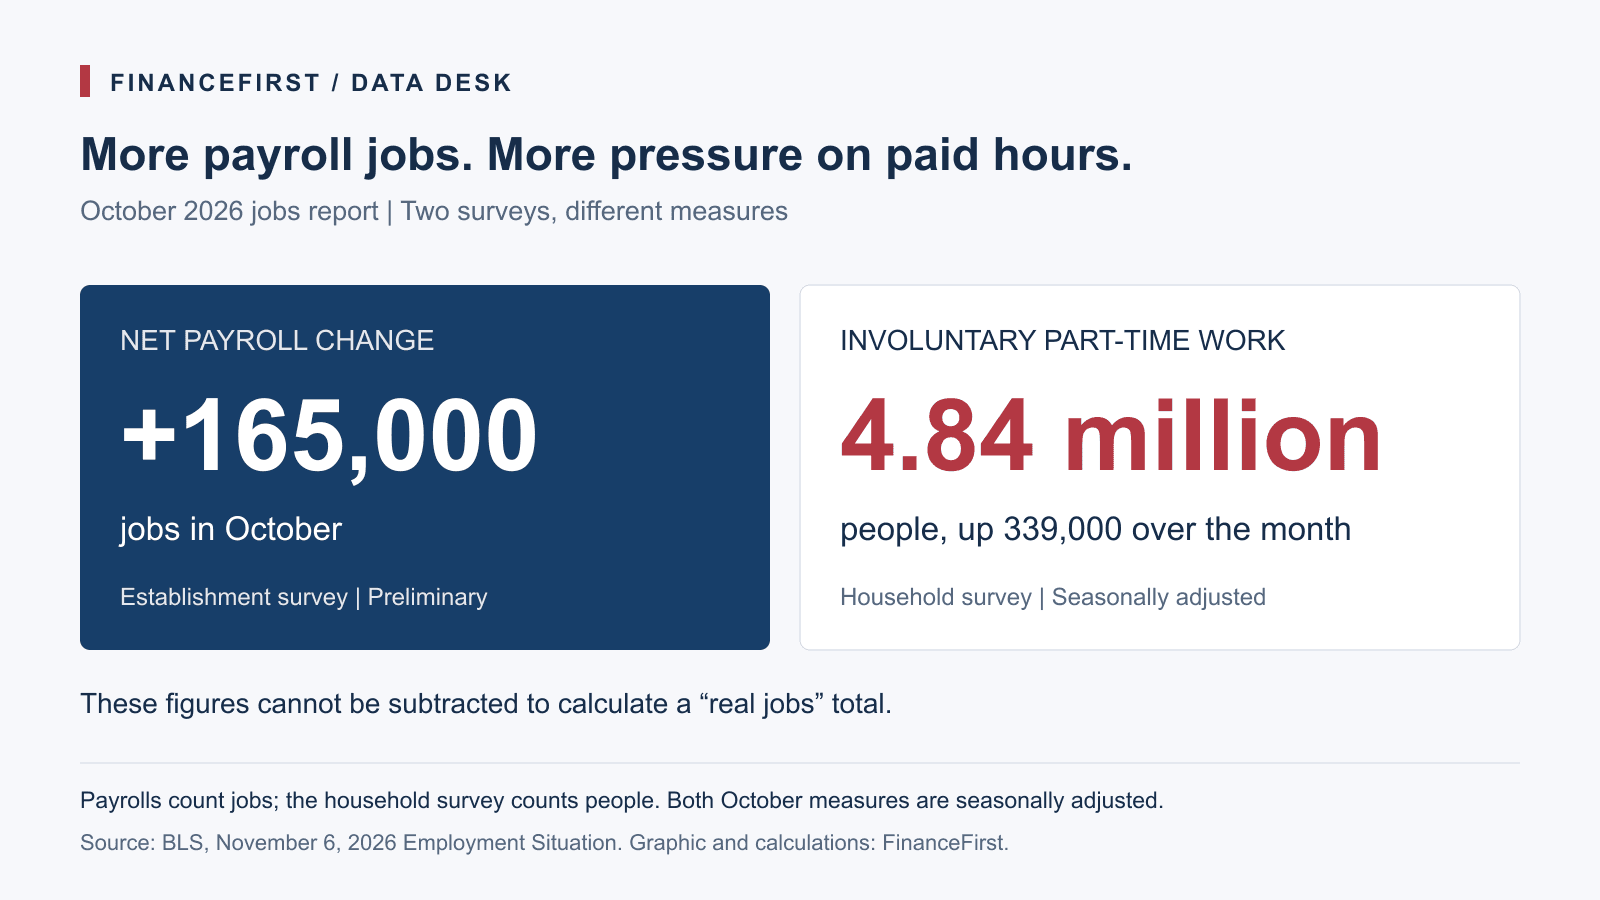
The report therefore contains two important signals: employers were adding jobs at a stronger recent pace, while access to paid hours remained a pressure point. An estimated 4.84 million people were working part time for economic reasons, up 339,000 from September. Source: BLS October Employment Situation.
October’s jobs report at a glance
Scroll sideways to see every column.
| Measure | October | Change or context |
|---|---|---|
| Nonfarm payrolls | +165,000 jobs | Above the preceding 12-month average of +48,000 |
| Unemployment rate | 4.1% | Little changed, according to BLS |
| Involuntary part-time employment | 4.840 million people | Up 339,000, or 7.5% |
| All private employees: weekly earnings | $1,307.20 | Up $4.82, or 0.37% |
| Production and nonsupervisory employees: weekly earnings | $1,106.95 | Up $0.79, or 0.07% |
Source: BLS November 6 release, Summary tables A/B and table B-8; percentage changes calculated by FinanceFirst. Seasonally adjusted; earnings are nominal averages. Payrolls count jobs, while the household survey counts people.
Revisions strengthen the recent hiring trend
BLS revised August’s payroll gain from 133,000 to 186,000 and September’s from 29,000 to 60,000, adding 84,000 jobs to the earlier estimates. With October included, employers added 411,000 jobs over three months, averaging 137,000 a month.
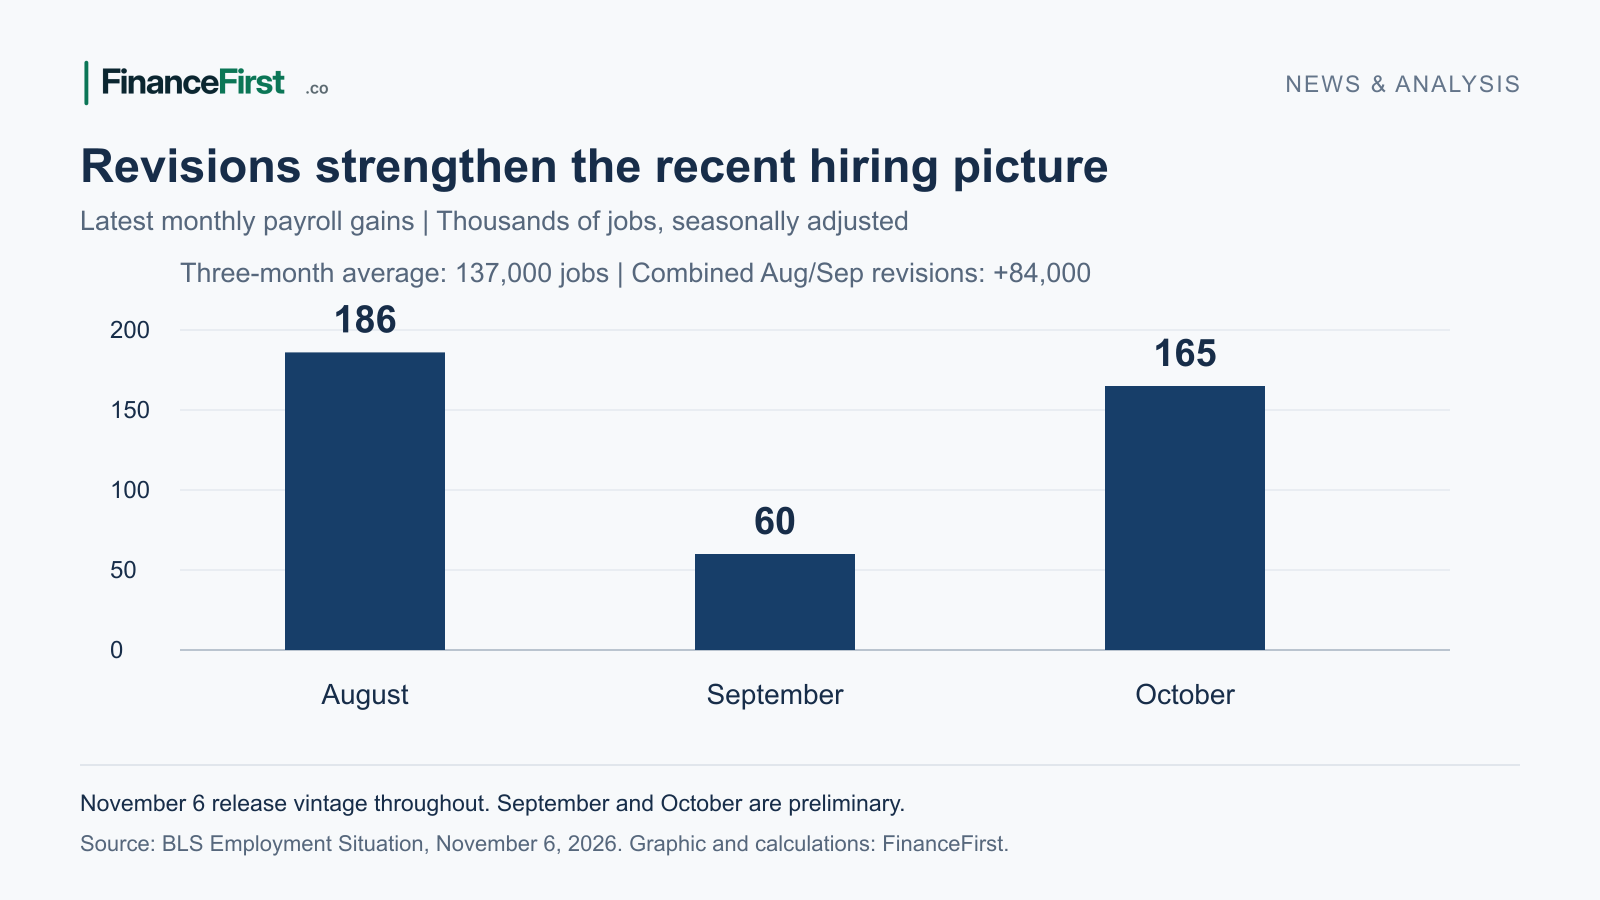
The improvement was broader than the largest industry contributions alone suggest. The private-industry diffusion index rose from 54.2 to 57.6; readings above 50 indicate increases were more widespread than decreases across the industries measured. Professional and business services added 70,000 jobs, health care 42,000, and transportation and warehousing 24,800. Together, those sectors accounted for 82.9% of the net payroll gain.
Total private-sector aggregate weekly hours also edged up 0.1%. That adds an important counterweight to the hours-pressure story: the economy’s total volume of paid private-sector work increased, even as some workers had difficulty obtaining the schedule they wanted.
Higher hourly pay brought almost no weekly gain for a large worker group
The all-employee private workweek held at 34.4 hours. The production and nonsupervisory workweek, however, slipped by 0.1 hour. Its average hourly pay rose about 0.37%, while average weekly earnings rose about 0.07%—showing how fewer hours can offset much of an increase in the hourly rate.
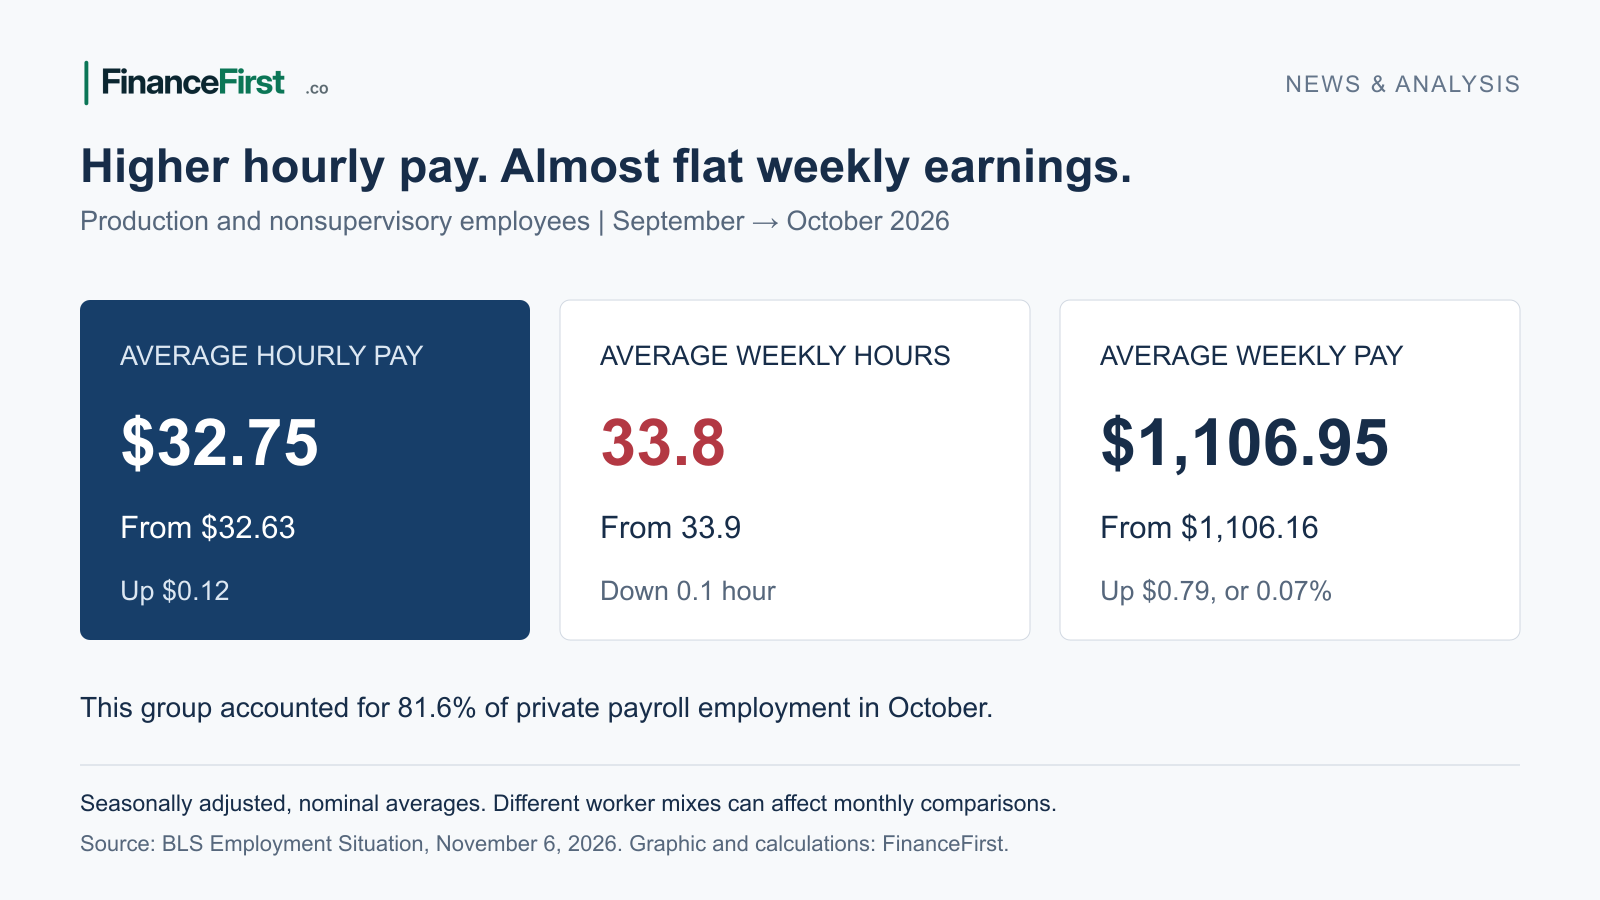
The industry detail makes the distinction clearer. For production and nonsupervisory employees in transportation and warehousing, average weekly earnings fell from $1,180.64 to $1,175.11, despite that industry’s overall payroll gain. In professional and business services, the corresponding weekly average rose from $1,426.53 to $1,437.78.
For household planning, a job’s hourly rate and its reliable paid schedule belong together. A higher quoted wage may help less than expected if hours are reduced. Compare recent take-home pay and scheduled hours with essential bills before committing to a new recurring payment; a cash-flow budget makes that comparison explicit.
The part-time increase was concentrated in reduced-hours conditions
Involuntary part-time employment rose from 4.501 million to 4.840 million. Within that measure, the “slack work or business conditions” estimate increased by 356,000, to 3.252 million. The number who could only find part-time work was nearly unchanged at 1.265 million.
The composition directs attention to the hours employers are offering, alongside the number of jobs they create. These household-survey estimates are separately seasonally adjusted, so their component changes need not sum exactly to the total. They complement payroll growth rather than offsetting it: subtracting 339,000 people from 165,000 payroll jobs would mix two different measures.
The unemployment rate supplies a steadier backdrop. It has remained between 4.1% and 4.3% since March, and labor-force participation was little changed at 61.9%. October’s release points to stronger hiring alongside a specific hours problem, rather than a clear-cut shift across every measure of labor-market conditions.
What this changes for households, employers and investors
Households: use dependable take-home pay, rather than the national hourly-earnings average, to assess a loan payment or savings commitment. For variable schedules, compare essential expenses with a plausible lower-hours month and size an emergency cash buffer around that gap.
Employers and job seekers: the industry gains identify places to investigate, but the offer’s hours and pay determine its financial value. Growing headcounts and growing involuntary part-time work can coexist; a business may have applicants available while offering fewer hours than those applicants want.
Investors: the upward revisions and stronger industry breadth support the hiring side of the report, while nearly flat weekly earnings for a large worker group temper the income signal. A rate-policy assessment would also need inflation and subsequent data; this release alone does not settle the Federal Reserve’s next decision.
The next checks are persistence and revisions
The scheduled October JOLTS release on December 1 at 10 a.m. Eastern will add openings, hiring and separation data for the same month. The December 4 Employment Situation at 8:30 a.m. Eastern will show November’s jobs and hours readings, with further revisions.
The key question is whether stronger payroll growth begins to deliver more paid hours and firmer weekly income—or whether the gap between job creation and workers’ desired schedules widens. Those next observations will help distinguish a one-month movement from a developing pattern. BLS JOLTS release and schedule.
Reporting and methodology
Analysis · Editorial review: Asim Ahmad.
Methodology
FinanceFirst used the November 6 BLS release throughout. The revised August–October payroll average is (186,000 + 60,000 + 165,000) ÷ 3 = 137,000 jobs. Weekly-pay comparisons use tables B-7/B-8 and percentage changes from the published rounded values: production and nonsupervisory weekly earnings rose $0.79, or 0.07%. All dollar earnings are nominal; reported credit and chart sources identify the relevant worker groups.
Limitations
September and October payroll estimates are preliminary. Payroll jobs and household-survey people are different units; independently adjusted part-time components need not sum. Earnings are group averages affected by worker composition, rather than changes for the same individuals. October 2025 household data were not collected during the federal shutdown, limiting conventional year-earlier household comparisons.
Conflicts disclosure
No relevant financial interests or paid relationships were reported for this analysis.
Correction or update
Expanded November 6 analysis adds measured production and nonsupervisory hours and weekly earnings, industry pay comparisons and aggregate-hours context. Replaced the hypothetical income chart and simplified the payroll chart. The underlying release remains the November 6 BLS vintage.