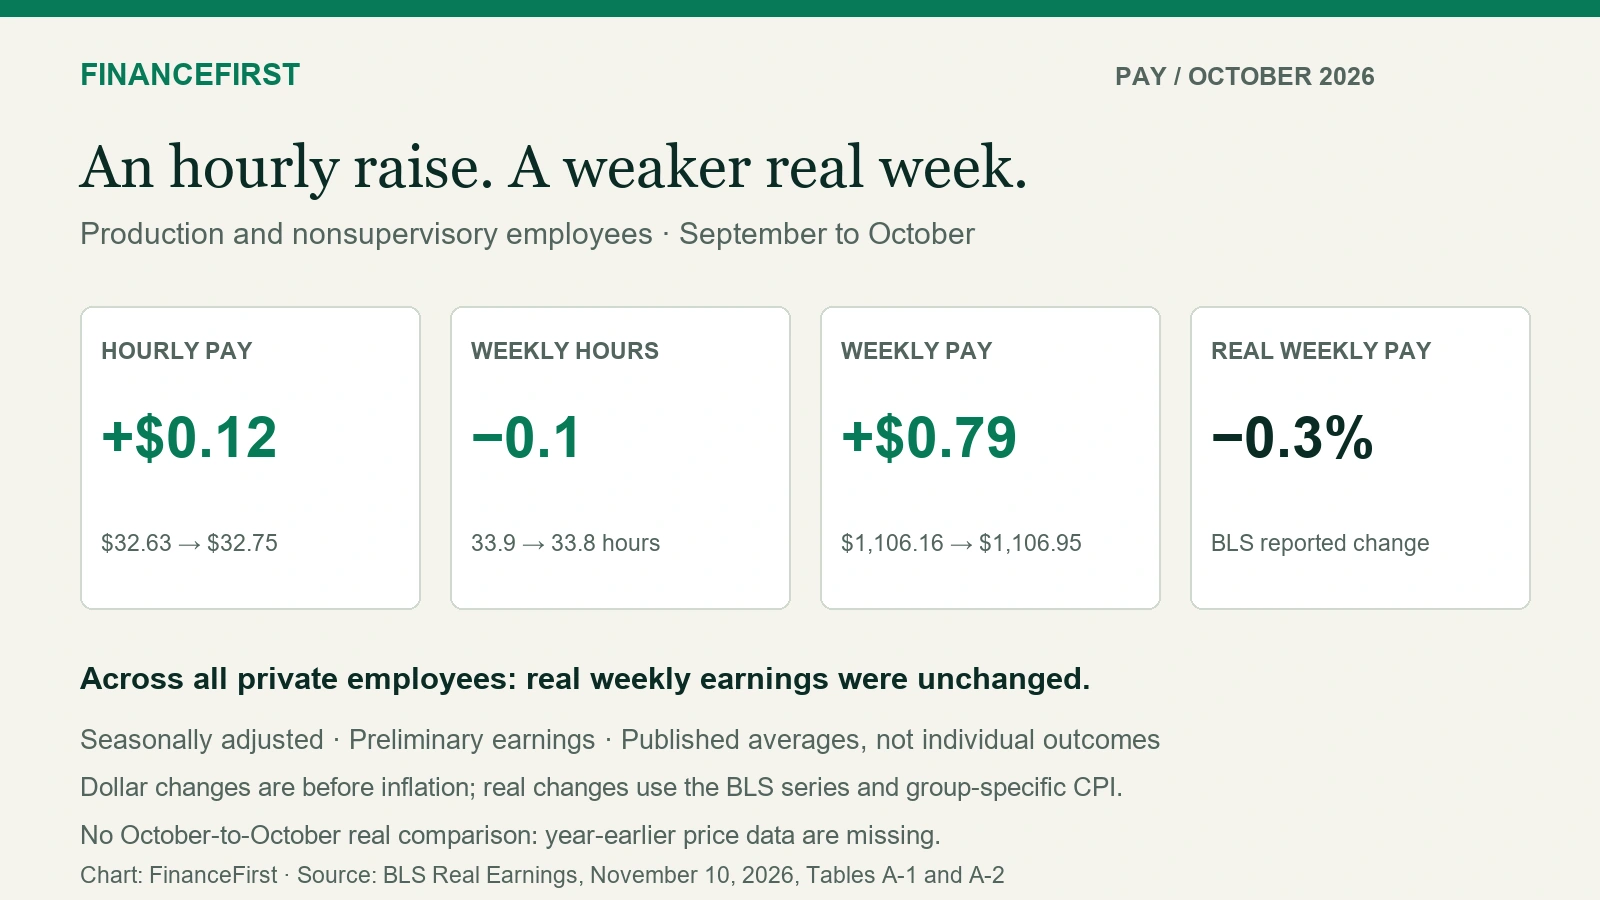
An hourly raise is not the same as getting ahead. New federal figures show average hourly pay increased in October, but inflation absorbed the gain across private-sector employees overall.
For production and nonsupervisory employees, shorter hours made the picture worse: inflation-adjusted weekly earnings fell 0.3%, even though their inflation-adjusted hourly earnings edged up 0.1%. Both figures are seasonally adjusted changes from September. [1]
That is the distinction worth checking before celebrating a wage headline. A household pays bills with the income earned across its working hours, not an hourly rate alone.
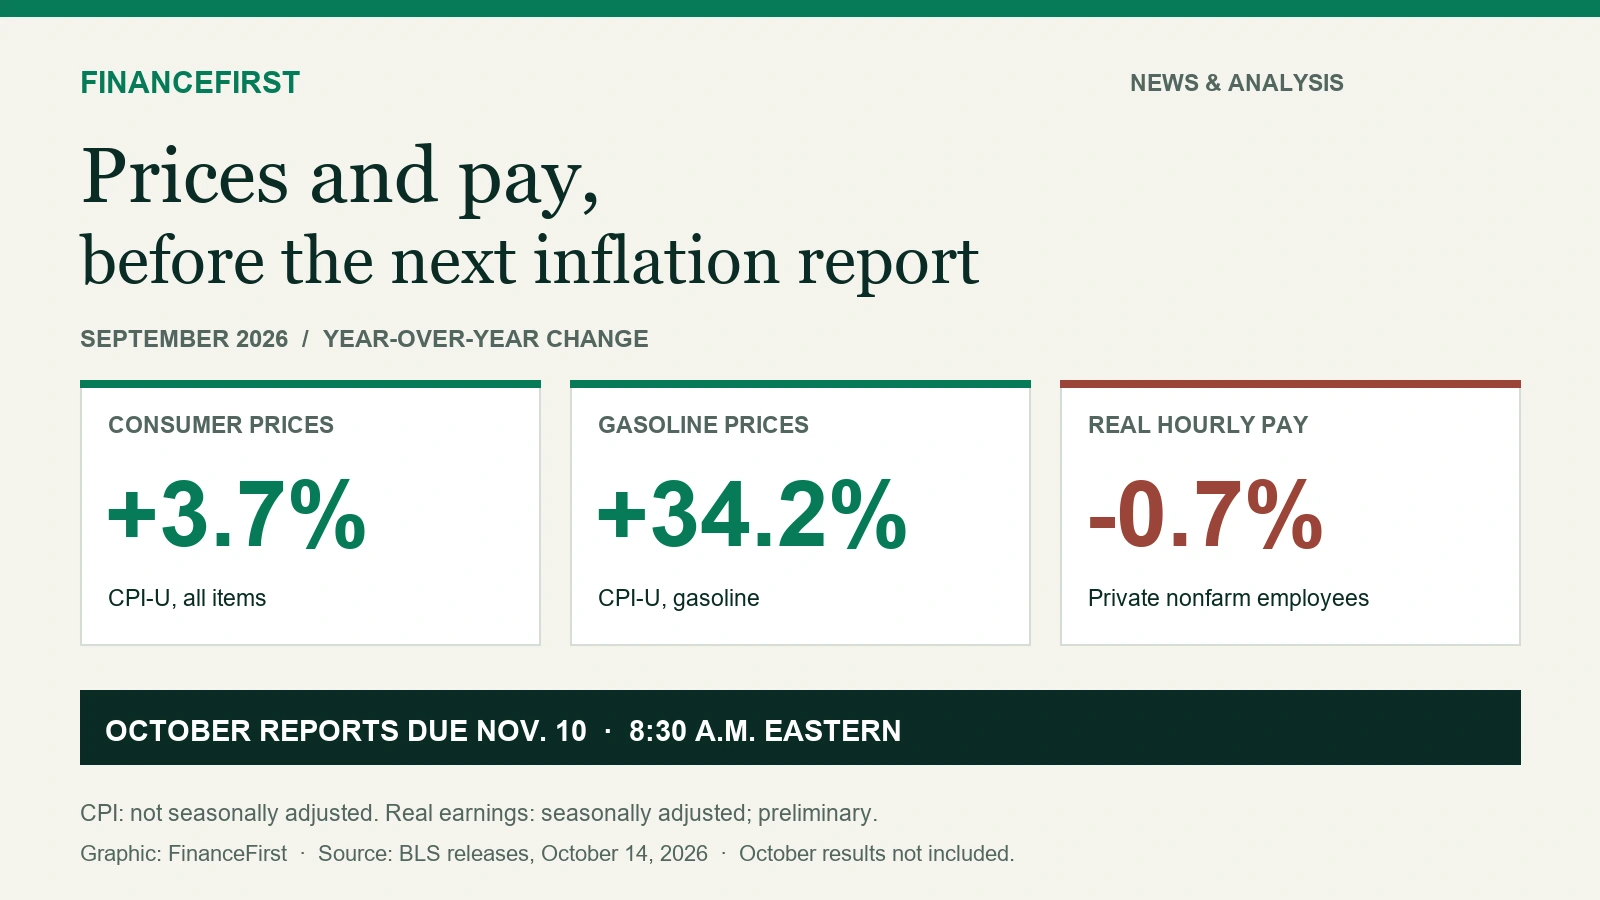
The Bureau of Labor Statistics released the October inflation and real-earnings reports on November 10, 2026. This is the results-based follow-up to FinanceFirst’s October CPI and pay preview, which used September observations. The new figures also come with an unusual limitation: missing October 2025 price data prevent the usual headline annual inflation comparison and annual real-earnings comparison. [1][2]
What happened to pay, hours and purchasing power?
Scroll sideways to see every column.
September-to-October change, seasonally adjusted | All private nonfarm employees | Production and nonsupervisory employees |
|---|---|---|
Average hourly earnings | +0.4% | +0.4% |
Average weekly hours | 0.0% | -0.3% |
Average weekly earnings, before inflation adjustment | +0.4% | +0.1% |
Inflation-adjusted average hourly earnings | 0.0% | +0.1% |
Inflation-adjusted average weekly earnings | 0.0% | -0.3% |
Sources: BLS Tables A-1 and A-2. September and October earnings figures are preliminary. The two employee groups use different inflation indexes. Reported percentage changes are rounded. [3][4]
For all private nonfarm employees, the reported 0.4% hourly pay increase matched the 0.4% rise in the Consumer Price Index for All Urban Consumers, or CPI-U. Average weekly hours were unchanged. Real hourly and weekly earnings were both unchanged at BLS's reported precision. [1][3]
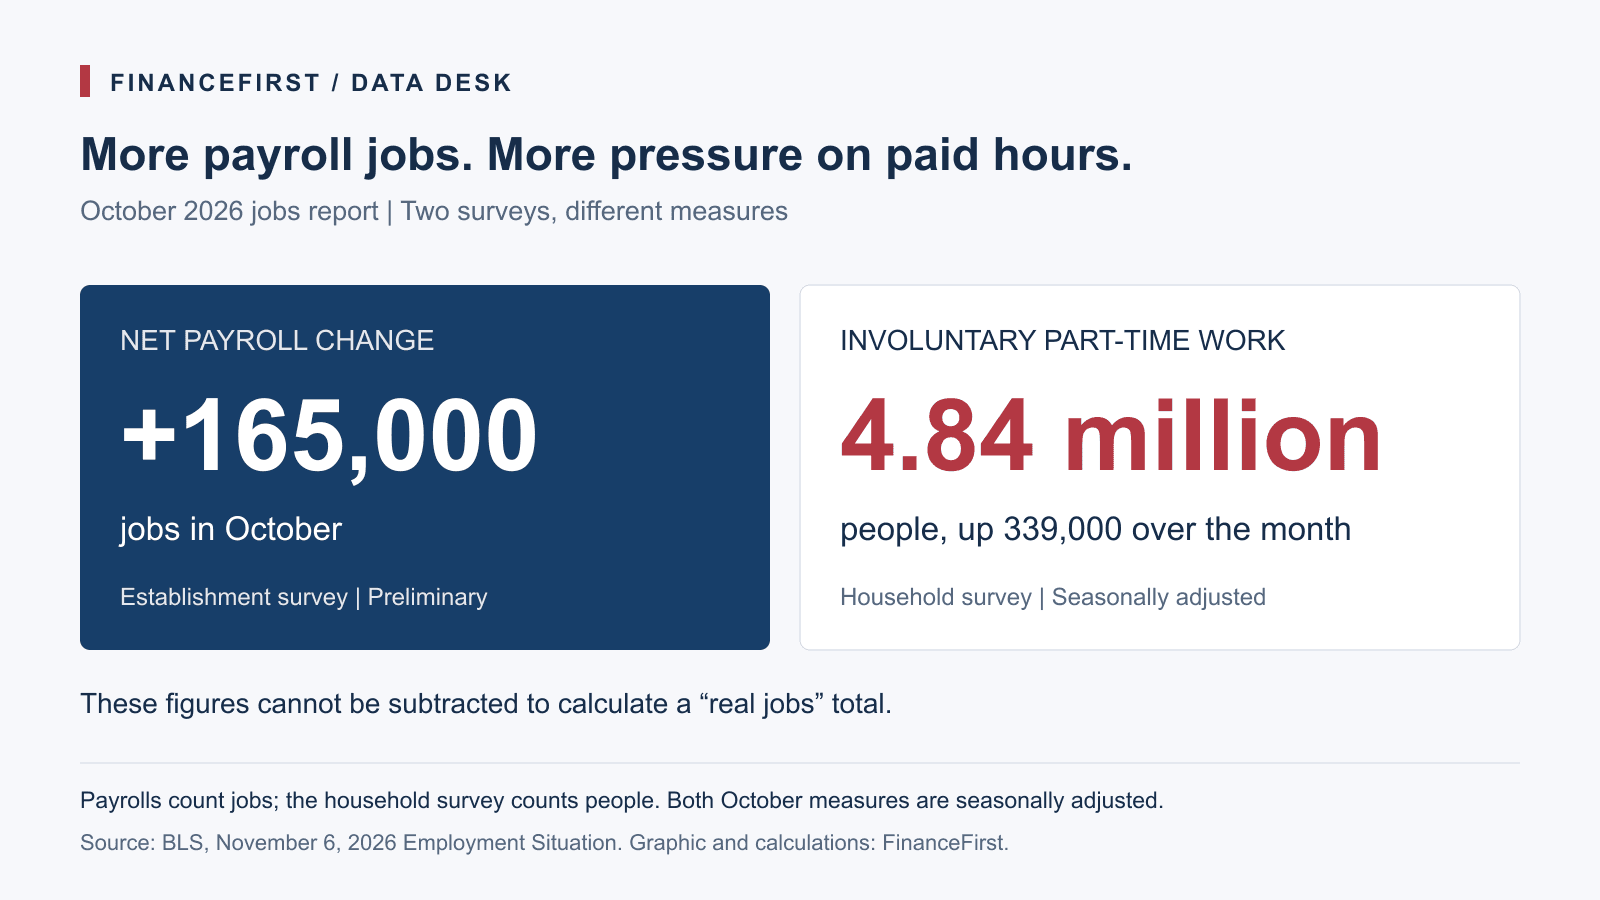
Production and nonsupervisory employees had a small real hourly gain, but their average workweek shortened. That left their weekly purchasing power lower. FinanceFirst’s October jobs report analysis covers payroll counts and part-time work, separate measures from these real-earnings averages. These employees account for approximately four-fifths of employment on private nonfarm payrolls, according to the table's footnote. [4]
They are not a separate population from all employees: they are a subset of that broader group. Nor does this occupational classification mean every person in the group has a low income.
The hourly raise became a 79-cent weekly increase
The production and nonsupervisory figures make the relationship concrete.
Scroll sideways to see every column.
Published measure, seasonally adjusted | September 2026 | October 2026 |
|---|---|---|
Average hourly earnings | $32.63 | $32.75 |
Average weekly hours | 33.9 | 33.8 |
Average weekly earnings, current dollars | $1,106.16 | $1,106.95 |
Source: BLS Table A-2; both months preliminary. [4]
Average hourly earnings increased by 12 cents. But average weekly earnings rose by only 79 cents.
To understand the arithmetic, hold September's 33.9 hours fixed and apply October's $32.75 hourly rate. The result is $1,110.225, or $1,110.23 rounded to cents.
At October's actual published average of 33.8 hours, the corresponding product is $1,106.95. In this calculation, the shorter workweek offsets about $3.28 of the weekly amount the higher rate would otherwise produce.
This is an illustration using published averages, not a finding that each worker lost six minutes of work or $3.28. The sequence matters when separating the rate and hours effects, and the underlying inputs are rounded.
The official real-weekly-earnings measure, which accounts for inflation, fell 0.3%. That is more informative about average weekly purchasing power than the nominal 0.4% hourly wage increase alone.
Why the inflation adjustment differs between groups
BLS uses CPI-U to adjust all-employee earnings. It uses the Consumer Price Index for Urban Wage Earners and Clerical Workers, or CPI-W, for production and nonsupervisory earnings. [3][4]
In October, CPI-U increased 0.4% and CPI-W increased 0.3%, seasonally adjusted. That helps explain why the same rounded nominal hourly increase can accompany different rounded real-hourly results.
It would be misleading to apply one group's inflation index to the other and present the result as the published BLS measure.
It would also be misleading to add rounded figures mechanically. For example, the rounded 0.1% real-hourly increase and 0.3% hours decline do not reproduce the published 0.3% real-weekly decline by simple subtraction. BLS calculates from underlying levels, while the displayed percentages are rounded.
There is a further precision limitation in the public tables. Reconstructing this group's real hourly change from the displayed nominal wage and CPI-W levels gives about 0.028%, while its displayed real hourly levels imply about 0.101%. This analysis retains BLS's reported 0.1%; it does not claim those rounded inputs reproduce the rate identically by both methods. The two calculations are shown here so readers can inspect the discrepancy: nominal-and-CPI reconstruction = ((32.75 / 330.958) / (32.63 / 329.838) - 1) × 100 ≈ 0.028%; displayed real-level change = (9.90 / 9.89 - 1) × 100 ≈ 0.101%. The published inputs do not establish the reason for the difference.
Slower monthly inflation did not mean prices fell
The overall CPI-U increased 0.4% in October after rising 0.6% in September, seasonally adjusted. The pace slowed, but the price index still increased. [2]
Several household categories rose:
Scroll sideways to see every column.
Selected CPI category | September-to-October change | Adjustment basis |
|---|---|---|
Overall consumer prices | +0.4% | Seasonally adjusted |
Groceries: food at home | +0.4% | Seasonally adjusted |
Food away from home | +0.5% | Not seasonally adjusted |
Electricity | +0.9% | Seasonally adjusted |
Motor vehicle insurance | +0.7% | Seasonally adjusted |
Used cars and trucks | -1.2% | Seasonally adjusted |
Source: BLS October CPI release. Food away from home carries a not-seasonally-adjusted footnote; the other selected figures above are seasonally adjusted. [2]
These are changes in price indexes, not a prediction of the change in every reader's bill. Electricity consumption, insurance renewals, purchases and local prices can all differ from the national average.
The categories also should not be added together to calculate a household's inflation rate. They represent different expenditure shares. Buying a used car less often than groceries further changes how a particular month feels.
Why there is no headline annual inflation number
BLS says it did not collect survey data for October 2025 because of a lapse in appropriations. Most October 2025 CPI indexes could not be published. As a result, October 2026 twelve-month changes cannot be published where the corresponding year-earlier index is unavailable. [2]
The real-earnings release likewise omits October-to-October real comparisons because the relevant price data are missing. [1]
Missing is not zero. It is also not permission to reuse September's annual inflation rate as October's.
Some individual CPI series do have published annual changes. The limitation should therefore be described as affecting the headline and other unavailable series, not as an absence of every annual price statistic.
Annual nominal earnings comparisons remain in the earnings tables. However, without the required price comparison, they cannot establish whether annual purchasing power rose or fell.
Annualizing one month's inflation would answer a different question: what if that monthly pace continued? It would not reconstruct the missing twelve-month observation. This analysis does not substitute such a calculation for the official annual figure.
What readers can actually do with this
If your hourly rate rose but money still feels tight, compare three things on your own records:
Your rate: What did you earn per hour before and after the change?
Your paid hours: Did scheduled hours, overtime or unpaid time change?
Your take-home amount: What changed after taxes, deductions and benefit costs?
The BLS figures concern average gross earnings and inflation adjustments, not your individual after-tax deposit. Still, they show why checking only the first number can miss an important part of the budget.
Compare bills over a consistent period as well. A larger electric bill can reflect more usage, a higher rate, fees or a mix of factors. The CPI electricity index does not separate those components on your household statement.
For employers and financial educators, the same distinction matters: a wage-rate announcement alone does not demonstrate that employees' weekly purchasing power improved.
What this analysis does not prove
These are national averages, not a panel following the same employees from one month to the next. Changes in the mix of jobs and workers can affect averages.
The data do not show that most individual workers experienced a real pay cut, that employers deliberately reduced hours, or that a particular policy caused the change. They also do not establish an annual trend from October alone.
September and October earnings figures are preliminary. Seasonally adjusted price measures can be revised. The real-dollar earnings levels in the source tables are expressed in constant 1982-1984 dollars and should not be mistaken for current-dollar wages.
The useful conclusion is narrower: in October's published averages, hourly pay growth did not translate into a real weekly gain across private employees overall. For production and nonsupervisory employees, weekly purchasing power moved backward.
Data behind the comparison
The table below retains published levels and official monthly changes. Earnings are preliminary and all rows are seasonally adjusted. Constant-dollar earnings use 1982–1984 purchasing power; they are not current-dollar pay. Use the CSV control to download the comparison. Annual real changes are unavailable, not zero. [3][4]
Scroll sideways to see every column.
Employee group | Measure | Units | September 2026 | October 2026 | Official monthly change, % |
|---|---|---|---|---|---|
All private nonfarm | Real average hourly earnings | 1982–1984 USD per hour | 11.26 | 11.26 | 0.0 |
All private nonfarm | Real average weekly earnings | 1982–1984 USD per week | 387.27 | 387.35 | 0.0 |
All private nonfarm | Consumer Price Index for All Urban Consumers | index 1982 1984 100 | 336.298 | 337.476 | 0.4 |
All private nonfarm | Average hourly earnings | Current USD per hour | 37.86 | 38.00 | 0.4 |
All private nonfarm | Average weekly hours | hours per week | 34.4 | 34.4 | 0.0 |
All private nonfarm | Average weekly earnings | Current USD per week | 1302.38 | 1307.20 | 0.4 |
Production/nonsupervisory | Real average hourly earnings | 1982–1984 USD per hour | 9.89 | 9.90 | 0.1 |
Production/nonsupervisory | Real average weekly earnings | 1982–1984 USD per week | 335.36 | 334.47 | -0.3 |
Production/nonsupervisory | Consumer Price Index for Urban Wage Earners and Clerical Workers | index 1982 1984 100 | 329.838 | 330.958 | 0.3 |
Production/nonsupervisory | Average hourly earnings | Current USD per hour | 32.63 | 32.75 | 0.4 |
Production/nonsupervisory | Average weekly hours | hours per week | 33.9 | 33.8 | -0.3 |
Production/nonsupervisory | Average weekly earnings | Current USD per week | 1106.16 | 1106.95 | 0.1 |
Sources and calculations
[1] BLS, Real Earnings, October 2026; released November 10, 2026: https://www.bls.gov/news.release/realer.nr0.htm
[2] BLS, Consumer Price Index, October 2026; released November 10, 2026: https://www.bls.gov/news.release/cpi.nr0.htm
[3] BLS Table A-1, all employees: https://www.bls.gov/news.release/realer.t01.htm
[4] BLS Table A-2, production and nonsupervisory employees: https://www.bls.gov/news.release/realer.t02.htm
Research checked November 10, 2026. FinanceFirst transcribed BLS observations and reproduced 12 calculations from the published levels. The official 0.1% production and nonsupervisory real-hourly change is retained with the reconstruction caveat above.
The next Real Earnings release, covering November 2026, is scheduled for December 10 at 8:30 a.m. Eastern. It will provide another observation; October alone does not establish a trend. [1]
Reporting and methodology
Analysis · Editorial review: Asim Ahmad.
Methodology
Uses November10,2026 BLS CPI and Real Earnings releases and TablesA-1/A-2. The tables transcribe official levels and rounded changes. FinanceFirst subtracts published weekly levels and applies the new hourly rate first at old hours, then changes hours. Twelve derived rows were reproduced with decimal arithmetic;144 earnings cells and168 CPI cells match saved source captures. Earnings use CPI-U for all employees and CPI-W for production/nonsupervisory employees. The public data table can be downloaded asCSV. Reconstructed rates from displayed nominal and CPI levels are diagnostics, not replacements for official BLS rates.
Limitations
National group averages do not follow the same workers or show most individuals lost pay. Production/nonsupervisory employees are a subset, not a synonym for low income. Earnings are preliminary and seasonal adjustments can be revised. The reported0.1% production/nonsupervisory real-hourly change differs from the0.028% reconstruction using displayed nominal/CPI levels, while displayed real levels give0.101%; the reason is not established here. Official rate retained with explicit caveat. Missing October2025 CPI prevents headline and affected annual comparisons; missing is not zero. Food away from home is NSA. No personal after-tax budget, causal finding or annual trend is inferred.
Conflicts disclosure
Uses public BLS statistics; no product recommendations, affiliate links, sponsored research or original interviews.
Sources
- Consumer Price Index Summary - 2026 M10 Results
- Real Earnings Summary - 2026 M10 Results
- Table A-1. Current and real (constant 1982-1984 dollars) earnings for all employees on private nonfarm payrolls, seasonally adjusted - 2026 M10 Results
- Table A-2. Current and real (constant 1982-1984 dollars) earnings for production and nonsupervisory employees on private nonfarm payrolls, seasonally adjusted - 2026 M10 Results