Q2 analysis, checked November 10, 2026 at 7:55 a.m. Eastern: This article examines the August 11 release and its mortgage-reporting qualification. It does not report Q3 findings; the next release is scheduled for 11 a.m. Eastern today.
America's household debt fell by $13 billion in the second quarter of 2026. On its own, that sounds like households made progress paying down what they owed.
But the number needs an explanation.
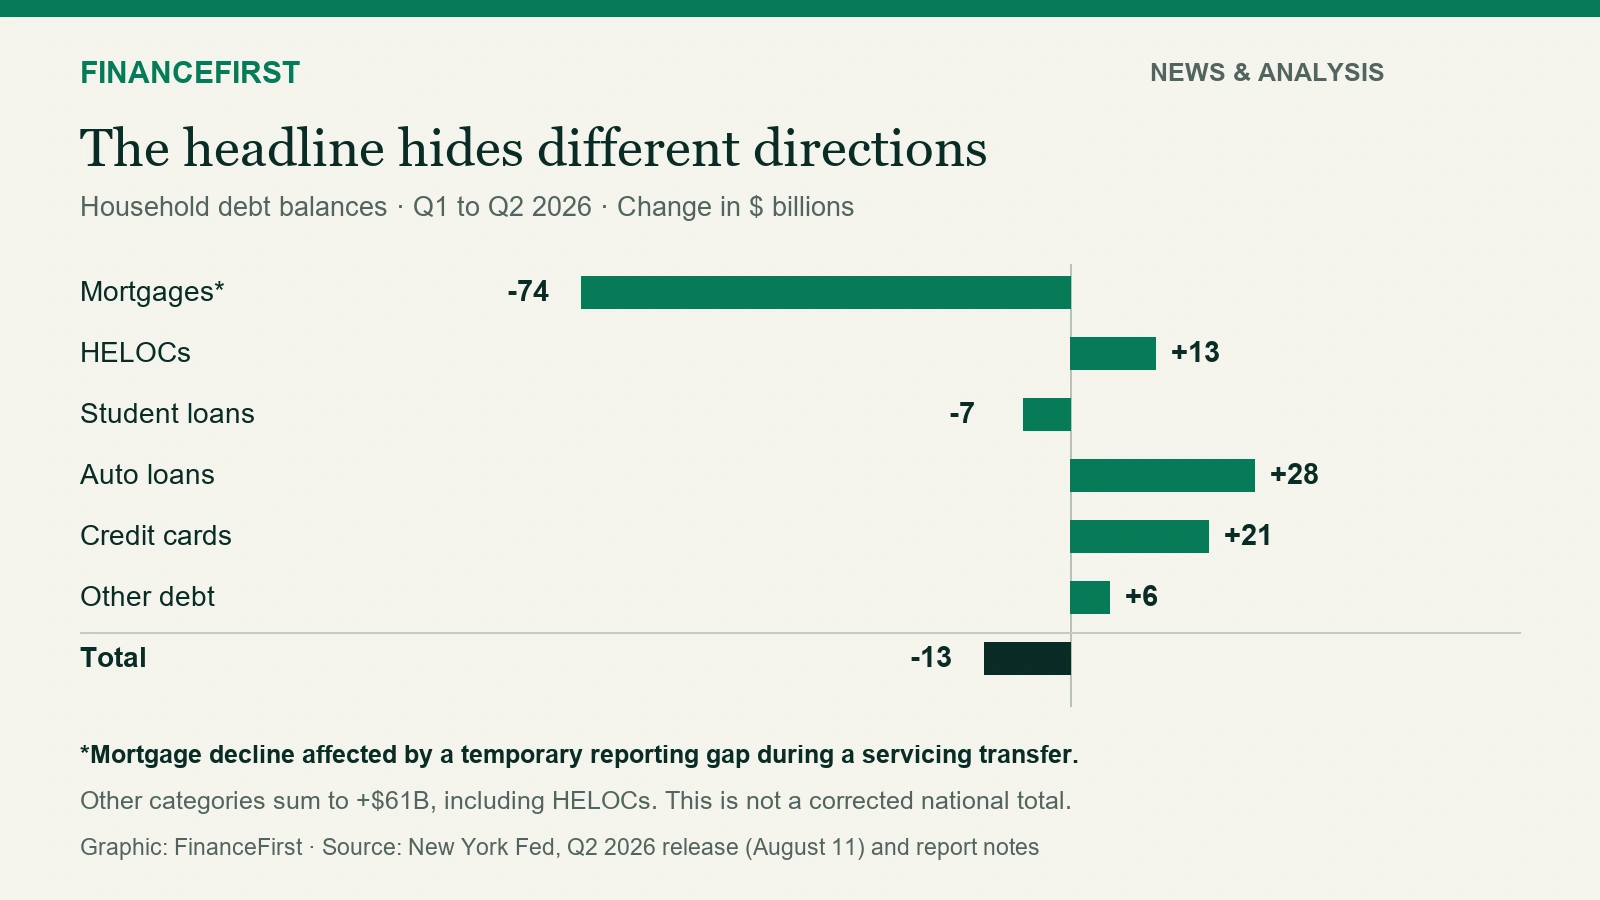
The New York Fed says a temporary gap in mortgage reporting, caused by a transfer of servicing, was responsible for the decline in reported mortgage balances. Meanwhile, credit card balances rose by $21 billion and auto balances rose by $28 billion. [1][2]
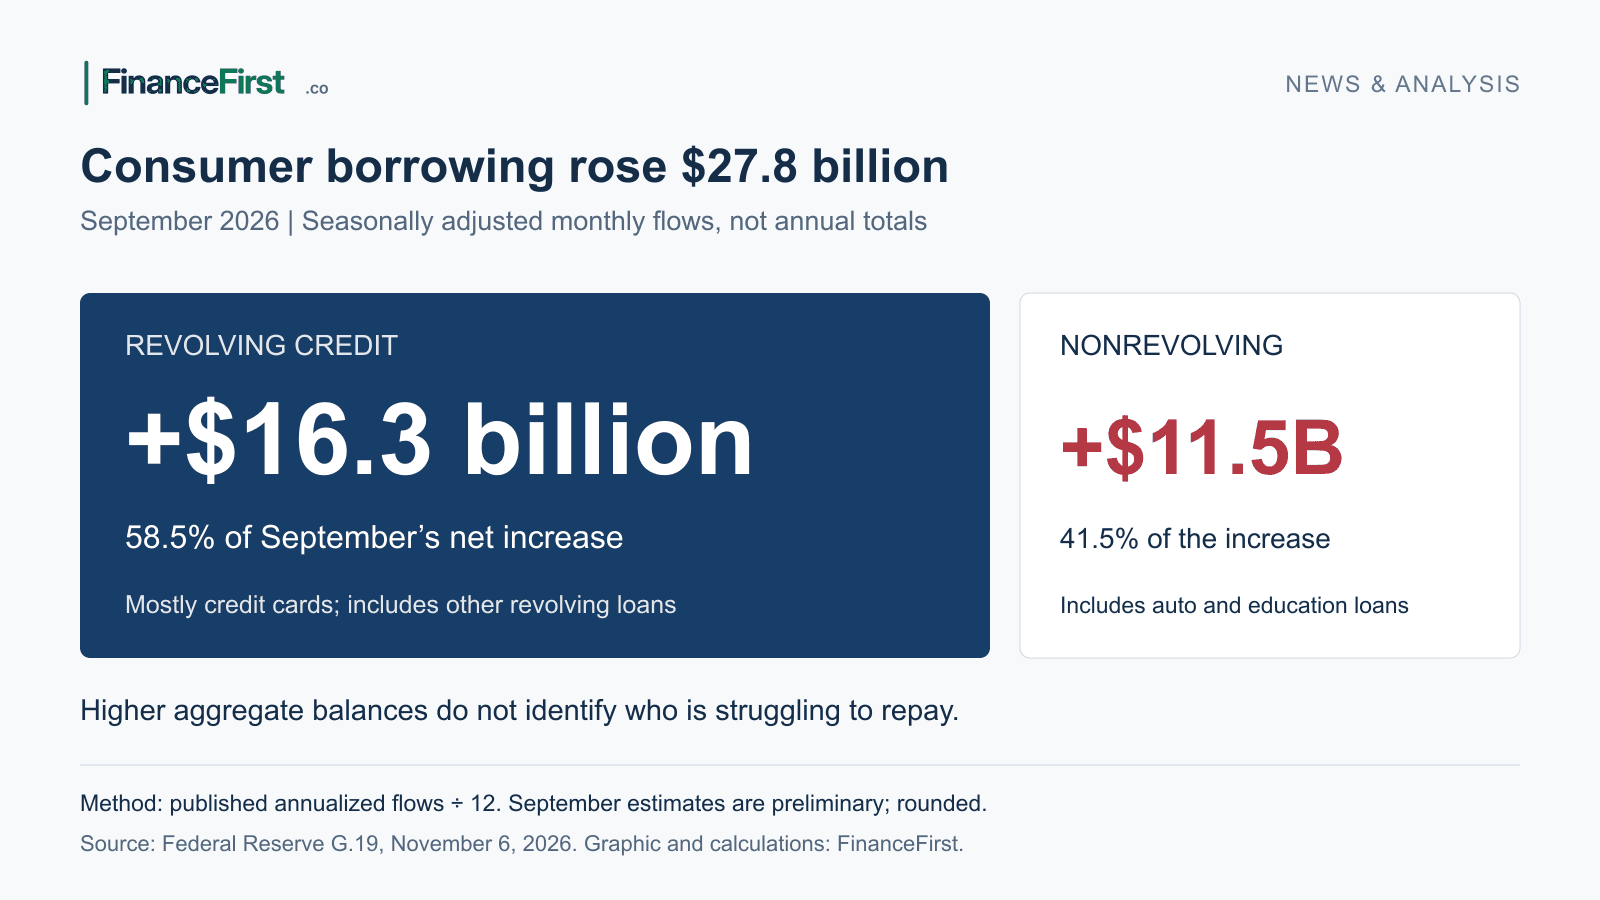
Those developments belong in the same story. FinanceFirst’s September consumer-credit analysis covers a different Federal Reserve series and period; its totals should not be substituted for this quarterly credit-report measure. A decrease in the total does not, by itself, show that families became less dependent on borrowing or found their payments easier to manage.
The timing matters. The Fed scheduled its next household debt report for November 10 at 11 a.m. Eastern. At our source check at 7:55 a.m. Eastern on November 10, its report page still displayed Q2 figures. This analysis explains that published baseline; it does not claim to report Q3 results. [3]
What changed beneath the headline
The Fed's August 11 release provides the following breakdown. Quarterly changes compare the end of March with the end of June 2026. [1]
Scroll sideways to see every column.
Debt category | Quarterly change, billions of dollars | End-Q2 balance, trillions of dollars |
|---|---|---|
Mortgages | -74 | 13.117 |
Home equity lines of credit | +13 | 0.459 |
-7 | 1.651 | |
Auto loans | +28 | 1.713 |
Credit cards | +21 | 1.263 |
Other debt | +6 | 0.568 |
Total | -13 | 18.771 |
Source: New York Fed. Figures have the precision published in its release. Components may not sum exactly to the total because of rounding. Download the New York Fed’s Q2 2026 source data workbook (Excel). The table above transcribes the release; the calculations below are FinanceFirst’s.
Two simple calculations make the split clearer:
Credit cards plus auto loans increased by $49 billion: $21 billion + $28 billion.
The categories other than mortgages increased by approximately $61 billion: $13 billion - $7 billion + $28 billion + $21 billion + $6 billion.
The second measure includes home equity lines of credit. That distinction is important: "excluding mortgages" is not the same as "excluding housing debt."
The Fed separately reports that nonhousing debt grew by $48 billion. Our sum of the rounded nonhousing category changes also gives $48 billion. Add the $13 billion HELOC increase, and the result is approximately $61 billion outside mortgages. [2]
These are changes in balances, not estimates of new purchases, loan originations or interest charges.
The mortgage footnote changes how to read the total
The Fed's report page states:
"The decline was due to a temporary gap in the reporting of mortgages on credit reports due to a transfer of servicing." [2]
This is a reporting issue in the data used to measure debt. It is not evidence that the affected mortgage obligations were forgiven or paid off.
For readers, the useful distinction is between an obligation and its appearance in a statistical snapshot. A temporary absence from reported data can reduce a measured total without showing an equivalent improvement in borrowers' finances.
There is a limit to what we can calculate from this explanation. The source does not give us a separate, verified dollar estimate for the missing reporting in the material used here.
We therefore cannot add $74 billion back to the total and call that the true change in household debt. That would assume the entire published net mortgage movement equals the reporting gap, with no offsetting movement in the underlying balances. The published evidence does not establish that assumption.
The $61 billion calculation is a category subtotal, not a repaired national debt series.
Debt was lower than the previous quarter, but higher than a year earlier
The quarterly decrease was not a year-over-year decrease.
The same release reports total debt was $383 billion higher than in Q2 2025. Mortgage debt was up $182 billion over that year, auto debt was up $58 billion, and credit card debt was up $54 billion. [1]
Both comparisons can be correct: the measured total can fall from March to June while remaining above its level the previous June.
That is why a useful debt headline needs a time period. "Debt fell" is incomplete unless readers know whether it means over a quarter, over a year or after adjusting for inflation. The changes in this article are nominal, not inflation-adjusted.
Higher balances do not tell us who is struggling
A larger national credit card balance is not a count of households behind on their payments.
The data come from the New York Fed's Consumer Credit Panel, a nationally representative sample drawn from anonymized Equifax credit data. They describe credit-report balances and payment status, not household budgets, savings accounts or individual reasons for borrowing. [1]
The release reports that 4.7% of outstanding debt was in some stage of delinquency at the end of June. That is a share of debt balances, not a statement that 4.7% of people were behind. [1]
It also reports a different measure: the flow into serious delinquency, meaning balances newly reaching at least 90 days past due.
Scroll sideways to see every column.
Debt category | Q2 2025 annualized transition rate | Q2 2026 annualized transition rate |
|---|---|---|
Mortgages | 1.29% | 1.52% |
Home equity lines of credit | 1.15% | 1.15% |
Student loans | 12.88% | 7.83% |
Auto loans | 2.93% | 3.00% |
Credit cards | 6.93% | 6.97% |
Other debt | 5.42% | 5.19% |
All debt | 2.91% | 2.57% |
Source: New York Fed. These are annualized shares of previously current or less-than-90-days-late balances transitioning into serious delinquency. They are not the percentage of borrowers newly delinquent during three months. [1]
For credit cards, the change was 0.04 percentage points, from 6.93% to 6.97%. That is a small numerical increase; this article does not claim it is statistically significant. The Fed described credit card delinquency transition rates as steady.
Student loan comparisons need particular care. The Fed flags distortions from the re-reporting of defaulted student debt. A lower published transition measure should not automatically be presented as proof that student borrowers' finances improved. [1][2]
What a household should take from this
The practical lesson is not that every family should borrow less immediately. The national data cannot answer that personal question.
It is that a smaller reported balance and a more manageable financial situation are different things.
For an individual budget, useful questions include:
Is the balance actually falling after interest and new charges?
Are required monthly payments affordable without taking on another debt?
Is money left for essential bills and an emergency?
If an account changes servicer, do statements and payment instructions match the lender's verified information?
FinanceFirst’s debt payoff calculator can help compare payment scenarios using your own balances and rates. Those are budgeting checks, not findings from the Fed credit-panel data. They connect the measurement issue to something a reader can use without pretending that a national average describes their own finances.
What to check when the next report arrives
The Q3 release should be assessed on its own evidence. The Fed's advisory says it will capture credit data through the end of September 2026. [3]
Three checks will matter:
First, read any update on the mortgage-reporting gap. Does the Fed say it persisted, resolved or prompted a revision? A rise in reported mortgage balances would not automatically mean an equivalent amount of new borrowing.
Second, separate mortgages, HELOCs and nonhousing debt. A single total can hide different directions across the categories.
Third, separate balances from payment trouble. Compare delinquency measures using the same definitions and periods. Do not mix the share already delinquent with the annualized flow newly reaching serious delinquency.
The advisory also says an accompanying Fed blog will examine newly delinquent credit card borrowers and changes in their socioeconomic profile. That is a planned research topic, not a result verified in this article. [3]
Read the components before judging the total
The published Q2 figures show a $13 billion decrease in total household debt. They also show approximately $61 billion of growth outside mortgages, including HELOCs, and a mortgage decline affected by a temporary reporting gap.
The responsible conclusion is narrower than either "Americans are paying off their debts" or "household debt is secretly surging."
The headline alone is not enough to judge household financial health. Read the category changes, the reporting notes and the payment measures together.
Primary sources
Federal Reserve Bank of New York, August 11, 2026. Household Debt Balances Decreased Slightly; Credit Card Delinquency Transition Rates Remained Steady. Includes category changes, balances, annual comparisons, delinquency tables and definitions. https://www.newyorkfed.org/newsevents/news/research/2026/20260811
Federal Reserve Bank of New York, Household Debt and Credit Report, displaying Q2 2026 at retrieval. Includes mortgage-reporting explanation and nonhousing subtotal. https://www.newyorkfed.org/microeconomics/hhdc
Federal Reserve Bank of New York, November 4, 2026. New York Fed to Release Q3 2026 Household Debt and Credit Report on November 10. https://www.newyorkfed.org/newsevents/mediaadvisory/2026/1104-2026
Reporting and methodology
Analysis · Editorial review: Asim Ahmad.
Methodology
The article uses the New York Fed’s August 11, 2026 release, Q2 report notes and November 4 release advisory. Category changes are nominal end-quarter balances. FinanceFirst sums the published rounded changes; $21 billion plus $28 billion equals $49 billion, and $13 billion minus $7 billion plus $28 billion plus $21 billion plus $6 billion equals approximately $61 billion. The latter includes HELOCs. No missing mortgage balance is imputed. Thirty-five numerical table values were checked against saved evidence and the fresh release. Source data are available through the linked official Q2 workbook.
Limitations
This is Q2 2026 analysis checked before the November 10 Q3 release, not Q3 breaking news. The mortgage-reporting explanation does not quantify a separately verified reporting gap or justify adding $74 billion back to create a corrected total. Credit-panel balances do not measure households, new purchases, originations, budgets or causal effects. The 4.7% delinquency stock is a share of debt, while serious-delinquency transitions are annualized balance flows. Student-loan re-reporting can distort comparisons. No significance test, inflation adjustment or household-level forecast is presented.
Conflicts disclosure
This analysis uses public New York Fed sources and contains no product recommendations, affiliate links, sponsored research or original interviews.