Preview: October CPI and Real Earnings are scheduled for November 10, 2026. This article uses September observations, the latest published data available November 9; October results are not included.
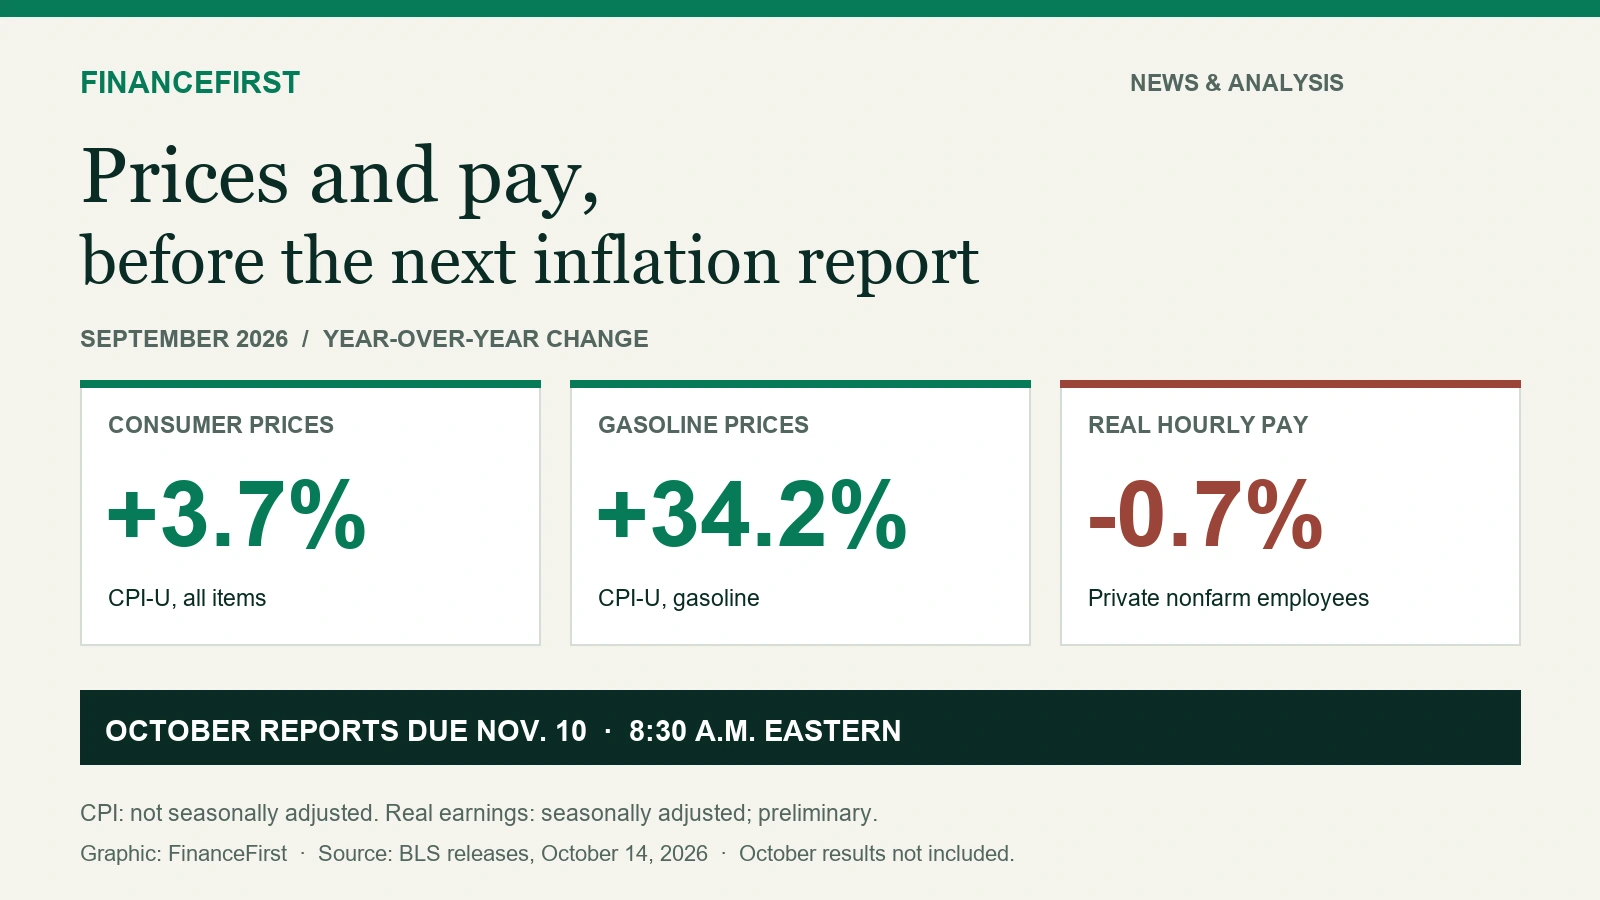
The latest inflation report showed a number that can feel far removed from a household's gas bill. Consumer prices were up 3.7% from September 2025 to September 2026. Gasoline prices were up 34.2% over the same period, while food prices rose 2.5% and shelter rose 3.2%.
At the same time, BLS estimated that real average hourly earnings for private-sector employees fell 0.7% over the year. “Real” earnings account for inflation. Real average weekly earnings fell 0.1%. [1][2]
Those figures do not describe every household. They do show why a national inflation rate and a paycheck trend can give different views of what people are experiencing.
The next update is scheduled for Tuesday, November 10, when the Bureau of Labor Statistics plans to release October CPI and October Real Earnings at 8:30 a.m. Eastern. The paired releases show how consumer prices and inflation-adjusted average earnings are changing. Each provides national context rather than a measure of an individual household’s budget. [3]
In September, prices rose at different speeds
The September CPI-U increased 0.6% from August after seasonal adjustment. Over 12 months, the index was up 3.7% before seasonal adjustment. These are different comparisons: the monthly figure is adjusted for typical seasonal patterns; the year-over-year figure is not. [1]
The categories varied widely:
Scroll sideways to see every column.
CPI category | Change from August to September, seasonally adjusted | Change from September 2025 to September 2026, not seasonally adjusted |
|---|---|---|
All items | +0.6% | +3.7% |
Food | 0.0% | +2.5% |
Food at home | -0.1% | +1.8% |
Energy | +5.2% | +20.4% |
Gasoline | +9.1% | +34.2% |
Electricity | +0.2% | +4.4% |
Shelter | +0.4% | +3.2% |
All items less food and energy | +0.3% | +2.6% |
Source: BLS, September 2026 CPI. Monthly comparisons are seasonally adjusted; 12-month comparisons are not. The table reports index changes, not the dollar amount a particular household spent. [1]
Gasoline rose 9.1% for the month after seasonal adjustment. BLS said gasoline accounted for more than half of the monthly increase in the all-items CPI. Before seasonal adjustment, gasoline prices rose 6.5% in September. Keeping those two measures distinct matters when describing what consumers paid. [1]
Meanwhile, the food index was unchanged for the month, and food at home declined 0.1%. Shelter rose 0.4%. A reader whose biggest monthly expense is rent may see a different pressure point than a reader who drives long distances.
Pay adjusted for inflation also matters
BLS's September Real Earnings release reported that real average hourly earnings for all employees on private nonfarm payrolls fell 0.5% from August to September. Nominal average hourly earnings rose 0.1% in that month, while the CPI-U rose 0.6%. The agency reported a 0.5% monthly decline in real average weekly earnings. [2]
Over the year ending September, real average hourly earnings fell 0.7%, while real average weekly earnings fell 0.1%. Nominal average weekly earnings rose 3.6% over the year, but prices and hours affect how much purchasing power that represents. [2]
These wage measures are averages across private nonfarm jobs, not a “typical worker's” paycheck. The series includes full-time and part-time jobs and multiple jobholders, and it is not adjusted for household size, location, occupation or personal spending mix. BLS itself cautions that the averages are not the earnings of a typical worker. [2]
August and September earnings estimates are preliminary and may be revised.
What to watch in Tuesday's release
Three questions will help readers assess the October report:
Monthly CPI: How much did the seasonally adjusted index change from September to October? A one-month change is not the same as the 12-month inflation rate.
The household-facing categories: What happened to food, shelter, energy, gasoline, electricity and other relevant indexes? A category's percentage change is not its contribution to a specific household's budget.
Real earnings: Did average inflation-adjusted hourly and weekly earnings rise or fall? Compare the relevant population and period, and check whether the figures are preliminary or revised.
BLS publishes its own inflation-adjusted earnings series. Subtracting two rounded headline growth rates is not a substitute for that estimate. A category's contribution to overall inflation also depends on its weight, not just the size of its percentage change.
What this evidence can and cannot tell a household
CPI estimates average price change for urban consumers. It does not track each family's actual purchases. Someone who drives frequently can be more exposed to gasoline prices than the national average, while someone with a different commute or vehicle may be less exposed. The report's index movement does not mean every household's fuel bill changed by the same percentage. FinanceFirst's electric-bill research separately examines annual electricity bills, which are a different measure from the CPI electricity index.
Real earnings are likewise a national average for defined payroll populations, not a household income series. They do not include every worker or every source of household income. Taken together, CPI and real earnings provide context, not a forecast or an individualized conclusion about whether a reader can afford a bill.
The next checkpoint is the paired October release on November 10 at 8:30 a.m. Eastern. October results were not available when this preview was prepared on November 9, 2026.
Sources
U.S. Bureau of Labor Statistics, Consumer Price Index, September 2026, released October 14, 2026. Release text: https://www.bls.gov/news.release/archives/cpi_10142026.htm. Includes Table 1.
U.S. Bureau of Labor Statistics, Real Earnings, September 2026, released October 14, 2026. Release text: https://www.bls.gov/news.release/archives/realer_10142026.htm. Includes Table A-1 and the technical note.
U.S. Bureau of Labor Statistics, November 2026 release schedule, modified November 3, 2026. Lists both October CPI and October Real Earnings for November 10 at 8:30 a.m. Eastern. https://www.bls.gov/schedule/2026/11_sched_list.htm
Reporting and methodology
Analysis · Editorial review: Asim Ahmad.
Methodology
Uses BLS September 2026 CPI and Real Earnings releases of October 14, plus the November calendar. Monthly CPI comparisons are seasonally adjusted; annual CPI comparisons are unadjusted. Earnings figures use the official deflated series and stated private nonfarm employee population. Data are transcribed, not independently estimated. The table separates the two comparison periods; no personal inflation calculation is made.
Limitations
This is a November 9 preview, not October-results reporting. The October releases are scheduled for November 10. August and September earnings estimates are preliminary. CPI reflects a broad urban-consumer basket, and average private-payroll earnings are not a typical worker or household-income measure. No individual affordability, forecast or causal claim is made. Annual electric-bill research is separate context, not CPI evidence.
Conflicts disclosure
This article uses public government statistics and contains no product recommendations or affiliate links.
Correction or update
Updated November 9, 2026 to add a sourced CPI-and-pay preview graphic with accessible text and to clarify the description of national indicators and household budgets. Reported figures are unchanged.