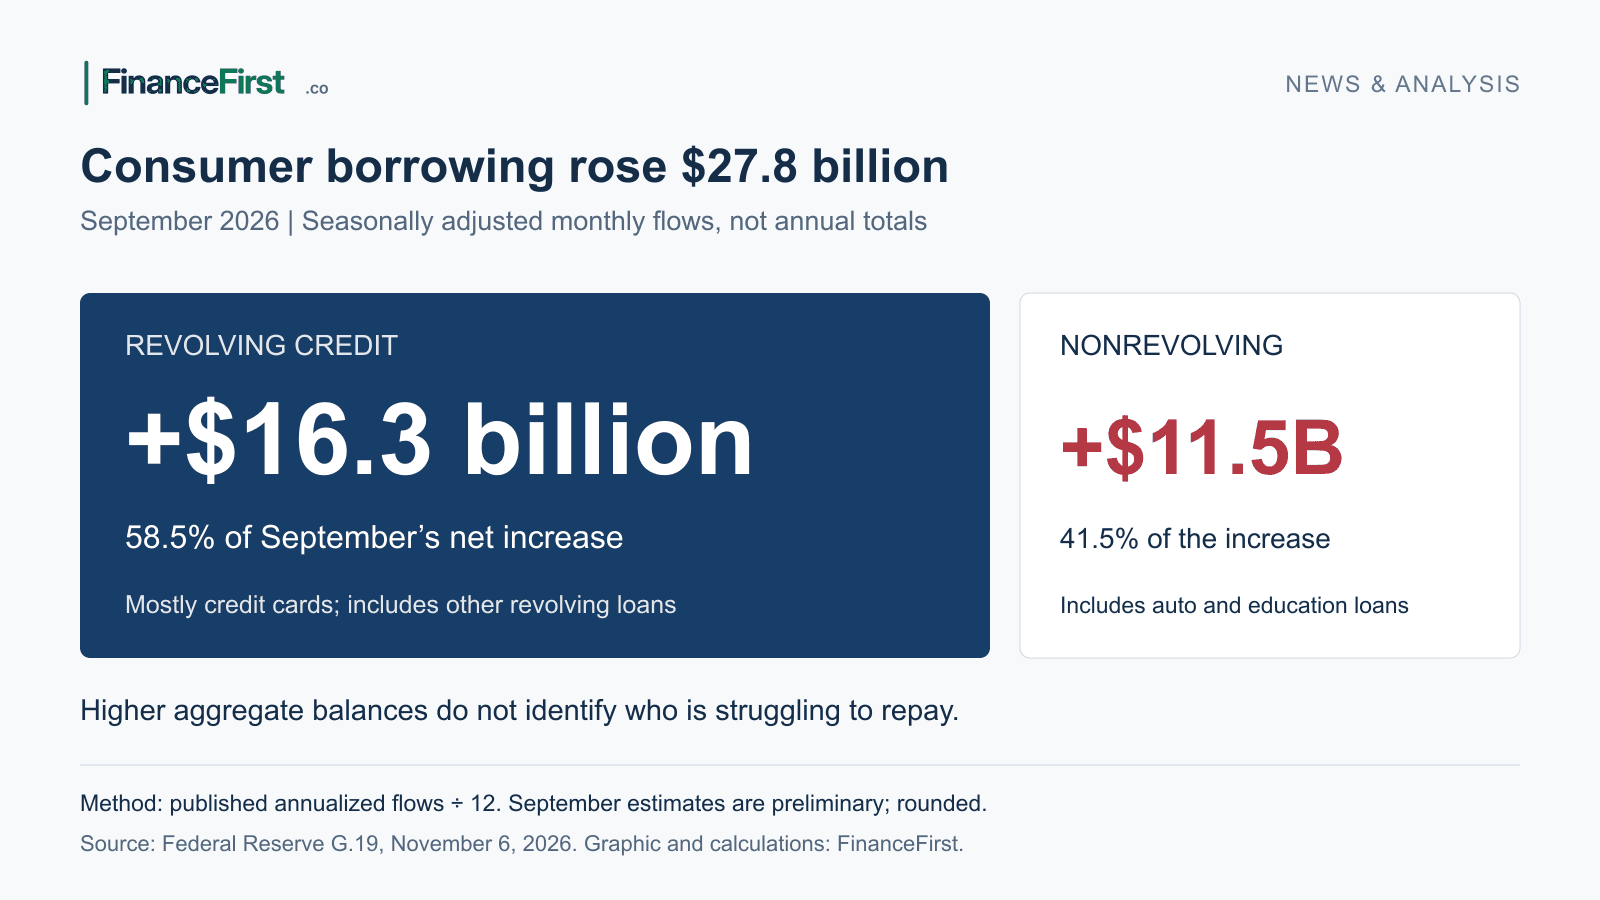
More borrowing does not mean easier access to credit for everyone. FinanceFirst’s September consumer-credit analysis examines changes in balances; this survey addresses a different question: how banks say their lending policies changed.
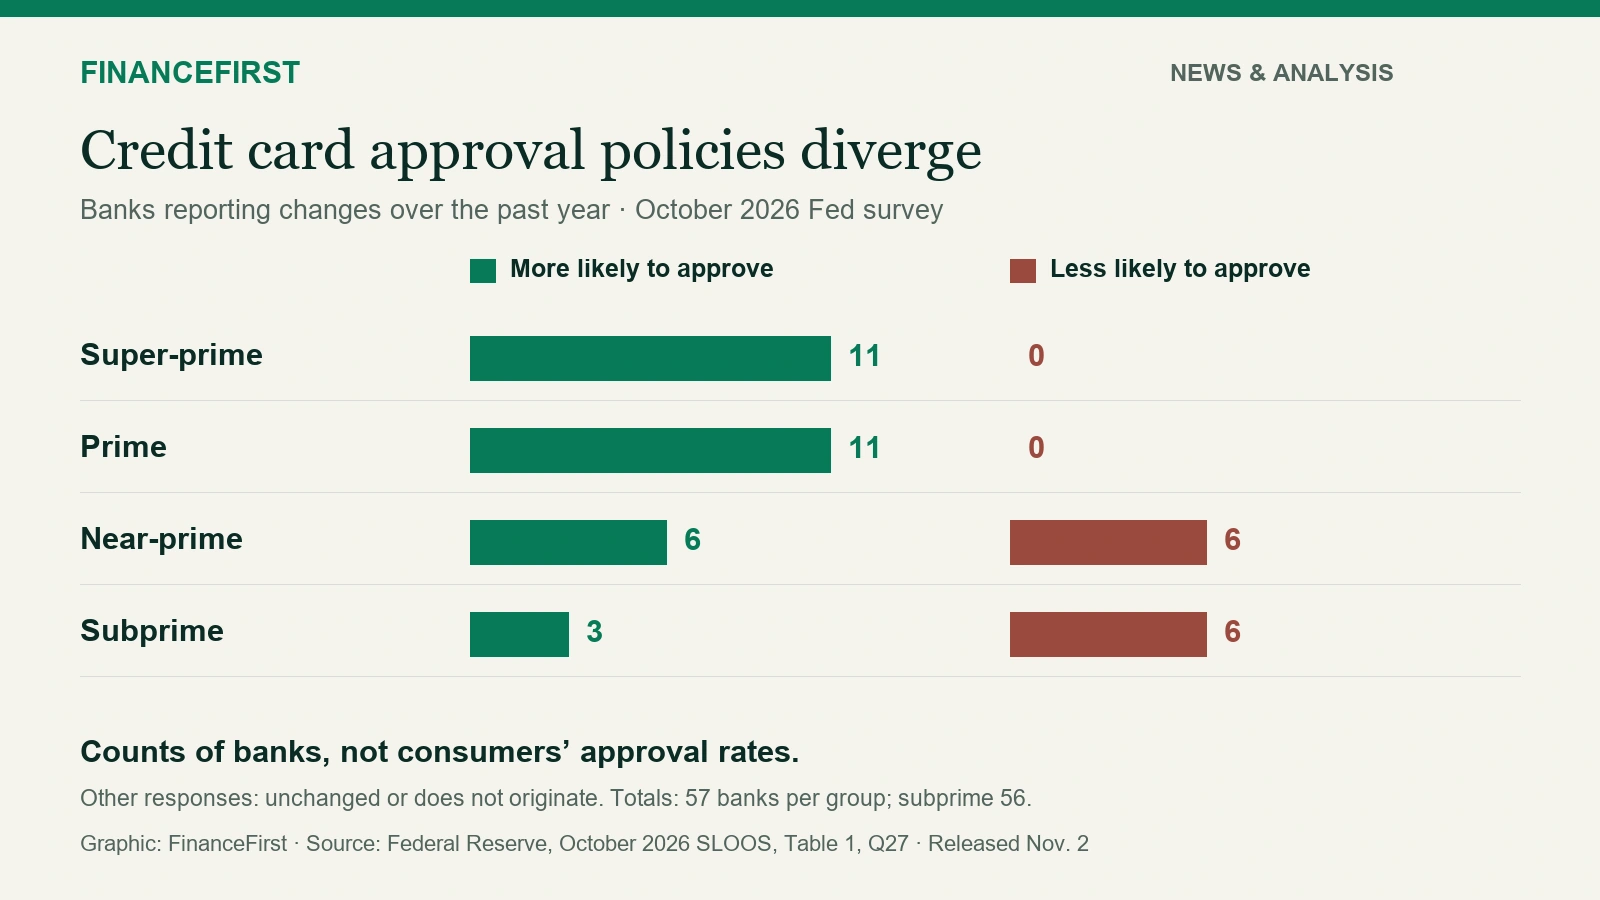
The Federal Reserve's latest bank-lending survey shows a split in reported credit card approval policies. Eleven banks said they had become more likely to approve applications from prime borrowers over the past year. None reported becoming less likely.
For subprime borrowers, six banks reported becoming less likely to approve applications, compared with three becoming more likely. [1][2]
Those are counts of banks, not approval rates. They do not mean that a prime applicant has a particular chance of getting a card, or that a subprime applicant will be rejected.
They do explain why a broad statement such as "credit is getting easier" can miss what different applicants face.
What the new Fed survey actually measured
The October 2026 Senior Loan Officer Opinion Survey on Bank Lending Practices was released on November 2. The survey received responses from 61 domestic banks and 18 U.S. branches and agencies of foreign banks. Banks received the questionnaire on September 21, with responses due October 5. [1][3]
Much of the survey asked about changes over the previous three months, generally corresponding to the third quarter. But the special credit card approval questions asked about changes over the past year.
That distinction matters. These results are not a measurement of lending decisions made during November or holiday shopping.
For each credit category, banks were asked how much more or less likely they were to approve an application, assuming the applicant's other characteristics were typical for that category.
Banks used their own definitions of super-prime, prime, near-prime and subprime borrowers. The questionnaire supplied example FICO ranges, but those examples are not universal approval thresholds. [2]
The divide, bank by bank
Here is how domestic banks answered the annual approval-policy questions:
Scroll sideways to see every column.
Borrower category | More likely to approve | About as likely | Less likely to approve | Do not originate cards for this category | Total responses |
|---|---|---|---|---|---|
Super-prime | 11 | 37 | 0 | 9 | 57 |
Prime | 11 | 37 | 0 | 9 | 57 |
Near-prime | 6 | 34 | 6 | 11 | 57 |
Subprime | 3 | 17 | 6 | 30 | 56 |
Source: Federal Reserve, October 2026 SLOOS, Table 1, Question 27. "More likely" combines "much more likely" and "somewhat more likely"; "less likely" combines the two corresponding negative responses. Counts are banks, not applications or borrowers. [2]
Three details stand out.
First, the direction was favorable for strong-credit applicants among banks reporting a change. Prime and super-prime borrowers each had 11 banks reporting greater willingness to approve and none reporting less willingness.
Second, near-prime applicants had an even split: six banks became more willing and six less willing.
Third, the subprime figures were less favorable, but they were not evidence of a universal pullback. Seventeen respondents reported no change, and 30 said they did not originate cards for that category.
Do not read those 30 banks as 30 recent exits. The response describes whether the bank originates that type of loan, not when or why it decided not to do so.
The Fed's summary describes the overall pattern similarly: banks became more likely to approve prime and super-prime applicants and less likely to approve subprime applicants, with small banks driving the subprime trend. [1]
Why the denominator changes the picture
It is useful to distinguish all respondents from respondents that lend to a particular category.
For prime borrowers, 57 banks answered. Nine said they did not originate those cards, leaving 48 respondents lending to the category. Eleven of those 48, or 22.9%, reported greater willingness to approve. The other 37 reported no change.
For subprime borrowers, 56 answered. Removing the 30 non-originating responses leaves 26 respondents lending to the category. Of those:
Six, or 23.1%, reported less willingness to approve.
Three, or 11.5%, reported greater willingness.
Seventeen, or 65.4%, reported no change.
These are FinanceFirst calculations from the published counts, not a separate Fed approval-rate series. [2]
Using all 56 subprime responses instead, the six less-willing banks account for 10.7%. Both calculations are correct, but they answer different questions. One describes all respondents to that question; the other describes respondents lending to that category.
Neither percentage tells a consumer their probability of approval.
The small counts also matter. A result involving six banks should not be described as proof that the entire card market has closed to people with weaker credit.
Banks also pointed to prices when discussing card demand
The survey asked banks which factors had affected credit card demand over the past year.
On the question about customers' spending needs in response to changes in the prices of goods and services, 20 banks said the factor had strengthened demand somewhat and one said it had strengthened demand significantly.
That is 21 of 51 respondents, or 41.2%. Three reported weaker demand from that factor, while 27 marked it not important. [2]
Here is the complete comparison across the six factors:
Scroll sideways to see every column.
Factor described in the questionnaire | Banks saying it strengthened demand | Total responses | Share saying it strengthened demand |
|---|---|---|---|
Customers' spending needs in response to prices of goods and services | 21 | 51 | 41.2% |
Customers' spending needs due to the economic outlook | 11 | 50 | 22.0% |
Customers' spending needs due to card interest rates and terms | 6 | 51 | 11.8% |
Customers' spending needs due to employment status or income | 5 | 50 | 10.0% |
Relative attractiveness of other bank credit sources | 1 | 51 | 2.0% |
Relative attractiveness of nonbank credit sources | 1 | 50 | 2.0% |
Source: Federal Reserve, Table 1, Question 28. FinanceFirst combined the two "strengthened demand" response categories and divided by each question's response total. The factors were asked separately; percentages should not be added. [2]
The price-related factor drew the largest share of strengthened-demand responses among the six listed factors.
That is worth reporting, but the wording needs care. Banks were giving their assessment of demand. The survey did not ask individual cardholders why they borrowed, measure their purchases or establish that inflation caused a particular balance to increase.
It also asked about price changes, not a quantified increase in each household's cost of living.
Why "standards were unchanged" does not settle the question
The Fed reported that overall lending standards for credit cards were basically unchanged over the third quarter. Yet it also reported some tightening in credit limits and in the extent to which banks granted loans to customers who did not meet credit-scoring thresholds. [1]
These findings are not necessarily contradictory.
The regular questions describe changes in standards and terms over the quarter. The special approval questions describe a year of changes for different borrower categories.
A bank can leave its broad card policy largely unchanged while adjusting a credit limit, making fewer exceptions or changing its willingness to approve a particular risk group.
For applicants, that is a reason to be cautious about treating a national lending headline as a description of the card they want.
If your application is denied, start with the reason
The practical response is not to guess what the survey means for your own credit score. It is to find out what the lender actually considered.
The Consumer Financial Protection Bureau recommends the following steps after a credit application is denied because of information in a credit report. [4]
1. Read the adverse action notice
The lender must provide the main reasons for the decision or tell you how to obtain them. If the notice tells you to request the reasons, pay attention to the 60-day window.
A denial based on information in a report is different from a statement that every bank would reach the same decision.
2. Request the report used in the decision
If the denial was based on your credit report, the notice should identify the credit reporting company and explain your right to request a free copy from that company within 60 days of the notice.
Reviewing that report gives you something specific to check, rather than relying on a broad label such as prime or subprime.
3. Dispute information you believe is wrong
The CFPB advises disputing inaccurate information with both the credit reporting company and the company that supplied it.
Correcting an error does not guarantee approval. It does help ensure that a future decision is based on accurate information. FinanceFirst’s guide to credit reports, balances and payment steps explains the broader process.
What this analysis cannot tell us
The survey is evidence about participating banks' reported policies and perceptions. It is not a census of every credit card issuer.
Our calculations count each responding bank once. They are not weighted by the bank's card balances, application volume or share of the market. Eleven banks therefore do not necessarily represent a larger amount of lending than six banks.
Response totals vary by question and borrower group. The special approval table includes non-originating responses, which must be kept separate from reports of tighter approval policies.
The survey provides no applicant-level approval rate, no count of rejected households and no proof that a specific bank changed policy because of inflation. The small response counts also do not establish statistical significance for the differences described here.
We cannot use these results to predict holiday borrowing, identify individual lenders' decisions or guarantee approval at any credit score.
The takeaway
The useful finding is narrower than "banks are making cards easier" or "banks are shutting borrowers out."
Among respondents reporting a change over the past year, approval policy moved in a more favorable direction for strong-credit applicants and a less favorable direction for subprime applicants. Most respondents reported no change or did not originate cards for the category.
For readers, the distinction is simple: a national increase in borrowing does not mean credit is becoming easier for every borrower. For someone denied a card, the lender's actual explanation is more useful than a national average.
Sources and calculations
Federal Reserve Board, October 2026 Senior Loan Officer Opinion Survey summary. Released November 2, 2026. Survey dates, respondent counts, quarterly standards and annual approval-policy findings: https://www.federalreserve.gov/data/sloos/sloos-202610.htm
Federal Reserve Board, October 2026 SLOOS, Table 1. Question 27: annual changes in approval likelihood by borrower category. Question 28: factors affecting card demand over the past year. https://www.federalreserve.gov/data/sloos/sloos-202610-table-1.htm
Federal Reserve Board, full October 2026 survey PDF. Cover specifies release at 2 p.m. ET on November 2, 2026: https://www.federalreserve.gov/data/documents/sloos-202610.pdf
Consumer Financial Protection Bureau, "What can I do if my credit application was denied because of my credit report?" Guidance reviewed December 31, 2024; accessed November 9, 2026: https://www.consumerfinance.gov/ask-cfpb/my-credit-application-was-denied-because-of-my-credit-report-what-can-i-do-en-1253/
Calculation note: Combined response categories are calculated from bank counts, not by adding rounded published percentages. Shares are rounded to one decimal place. For example, 6 / 56 x 100 = 10.7%, while 6 / (56 - 30) x 100 = 23.1%. Different denominators must not be substituted without relabeling.
Disclosure: This is analysis of publicly available primary sources, not original interviews, a borrower survey, individualized credit advice or a prediction of approval. The tables and calculation note above show the underlying response counts and formulas.
Reporting and methodology
Analysis · Editorial review: Asim Ahmad.
Methodology
Analysis of domestic-bank responses to Q27 and Q28 in the October2026 SLOOS, released November2. More/less likely and stronger/weaker demand combine their two corresponding response categories using counts. Shares divide by each stated response total; originating-bank denominators exclude does-not-originate responses. Percentages are rounded half-up to one decimal after calculation, not added from published rounded percentages. Banks are equally counted, not weighted by loan volume. All384 raw numeric cells matched archived evidence and the live Fed table; reproducible CSVs and code are retained in the source package.
Limitations
Special questions cover the past year, while regular standards/terms cover the prior quarter. Bank-defined risk categories have no universal FICO cutoff. Respondent totals vary; non-originating responses are not evidence of recent exits. This is a bank-policy/perception survey, not applicant approval rates, a market census, loan-volume-weighted results, a significance test or evidence that inflation caused individual borrowing. It cannot predict an applicant outcome or holiday borrowing.
Conflicts disclosure
This analysis uses public Federal Reserve and CFPB material, contains no affiliate links or product recommendations, and reports no interviews or sponsored research.